Fig. 6
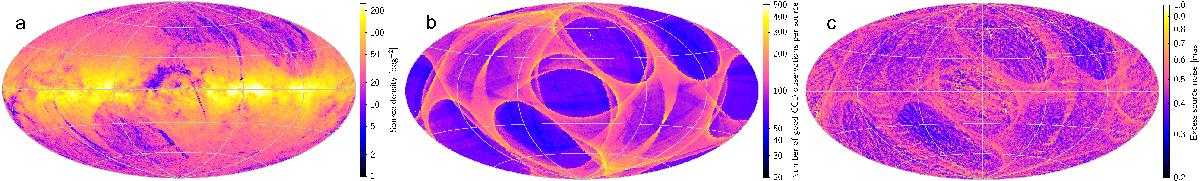
Summary statistics for the 2 million sources in the primary data set of Gaia DR1: a) density of sources; b) number of good CCD observations per source; c) excess source noise. These maps use an Aitoff projection in Galactic coordinates, with origin l = b = 0 at the centre and l increasing from right to left. The mean density (a) and median values (b and c) are shown for sources in cells of about 0.84 deg2. A small number of empty cells are shown in white.
Current usage metrics show cumulative count of Article Views (full-text article views including HTML views, PDF and ePub downloads, according to the available data) and Abstracts Views on Vision4Press platform.
Data correspond to usage on the plateform after 2015. The current usage metrics is available 48-96 hours after online publication and is updated daily on week days.
Initial download of the metrics may take a while.