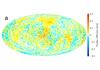
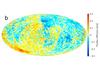
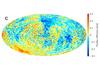
Fig. E.2

Differences in parallax between the baseline primary solution and a special validation solution where the data are split into early and late observations (within the AF). a) Baseline minus late. b) Baseline minus early. c) Late minus early. Median differences are shown in cells of about 3.36 deg2. The maps use an Aitoff projection in equatorial (ICRS) coordinates, with origin α = δ = 0 at the centre and α increasing from right to left.
Current usage metrics show cumulative count of Article Views (full-text article views including HTML views, PDF and ePub downloads, according to the available data) and Abstracts Views on Vision4Press platform.
Data correspond to usage on the plateform after 2015. The current usage metrics is available 48-96 hours after online publication and is updated daily on week days.
Initial download of the metrics may take a while.