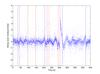
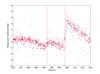
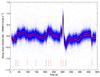
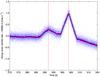
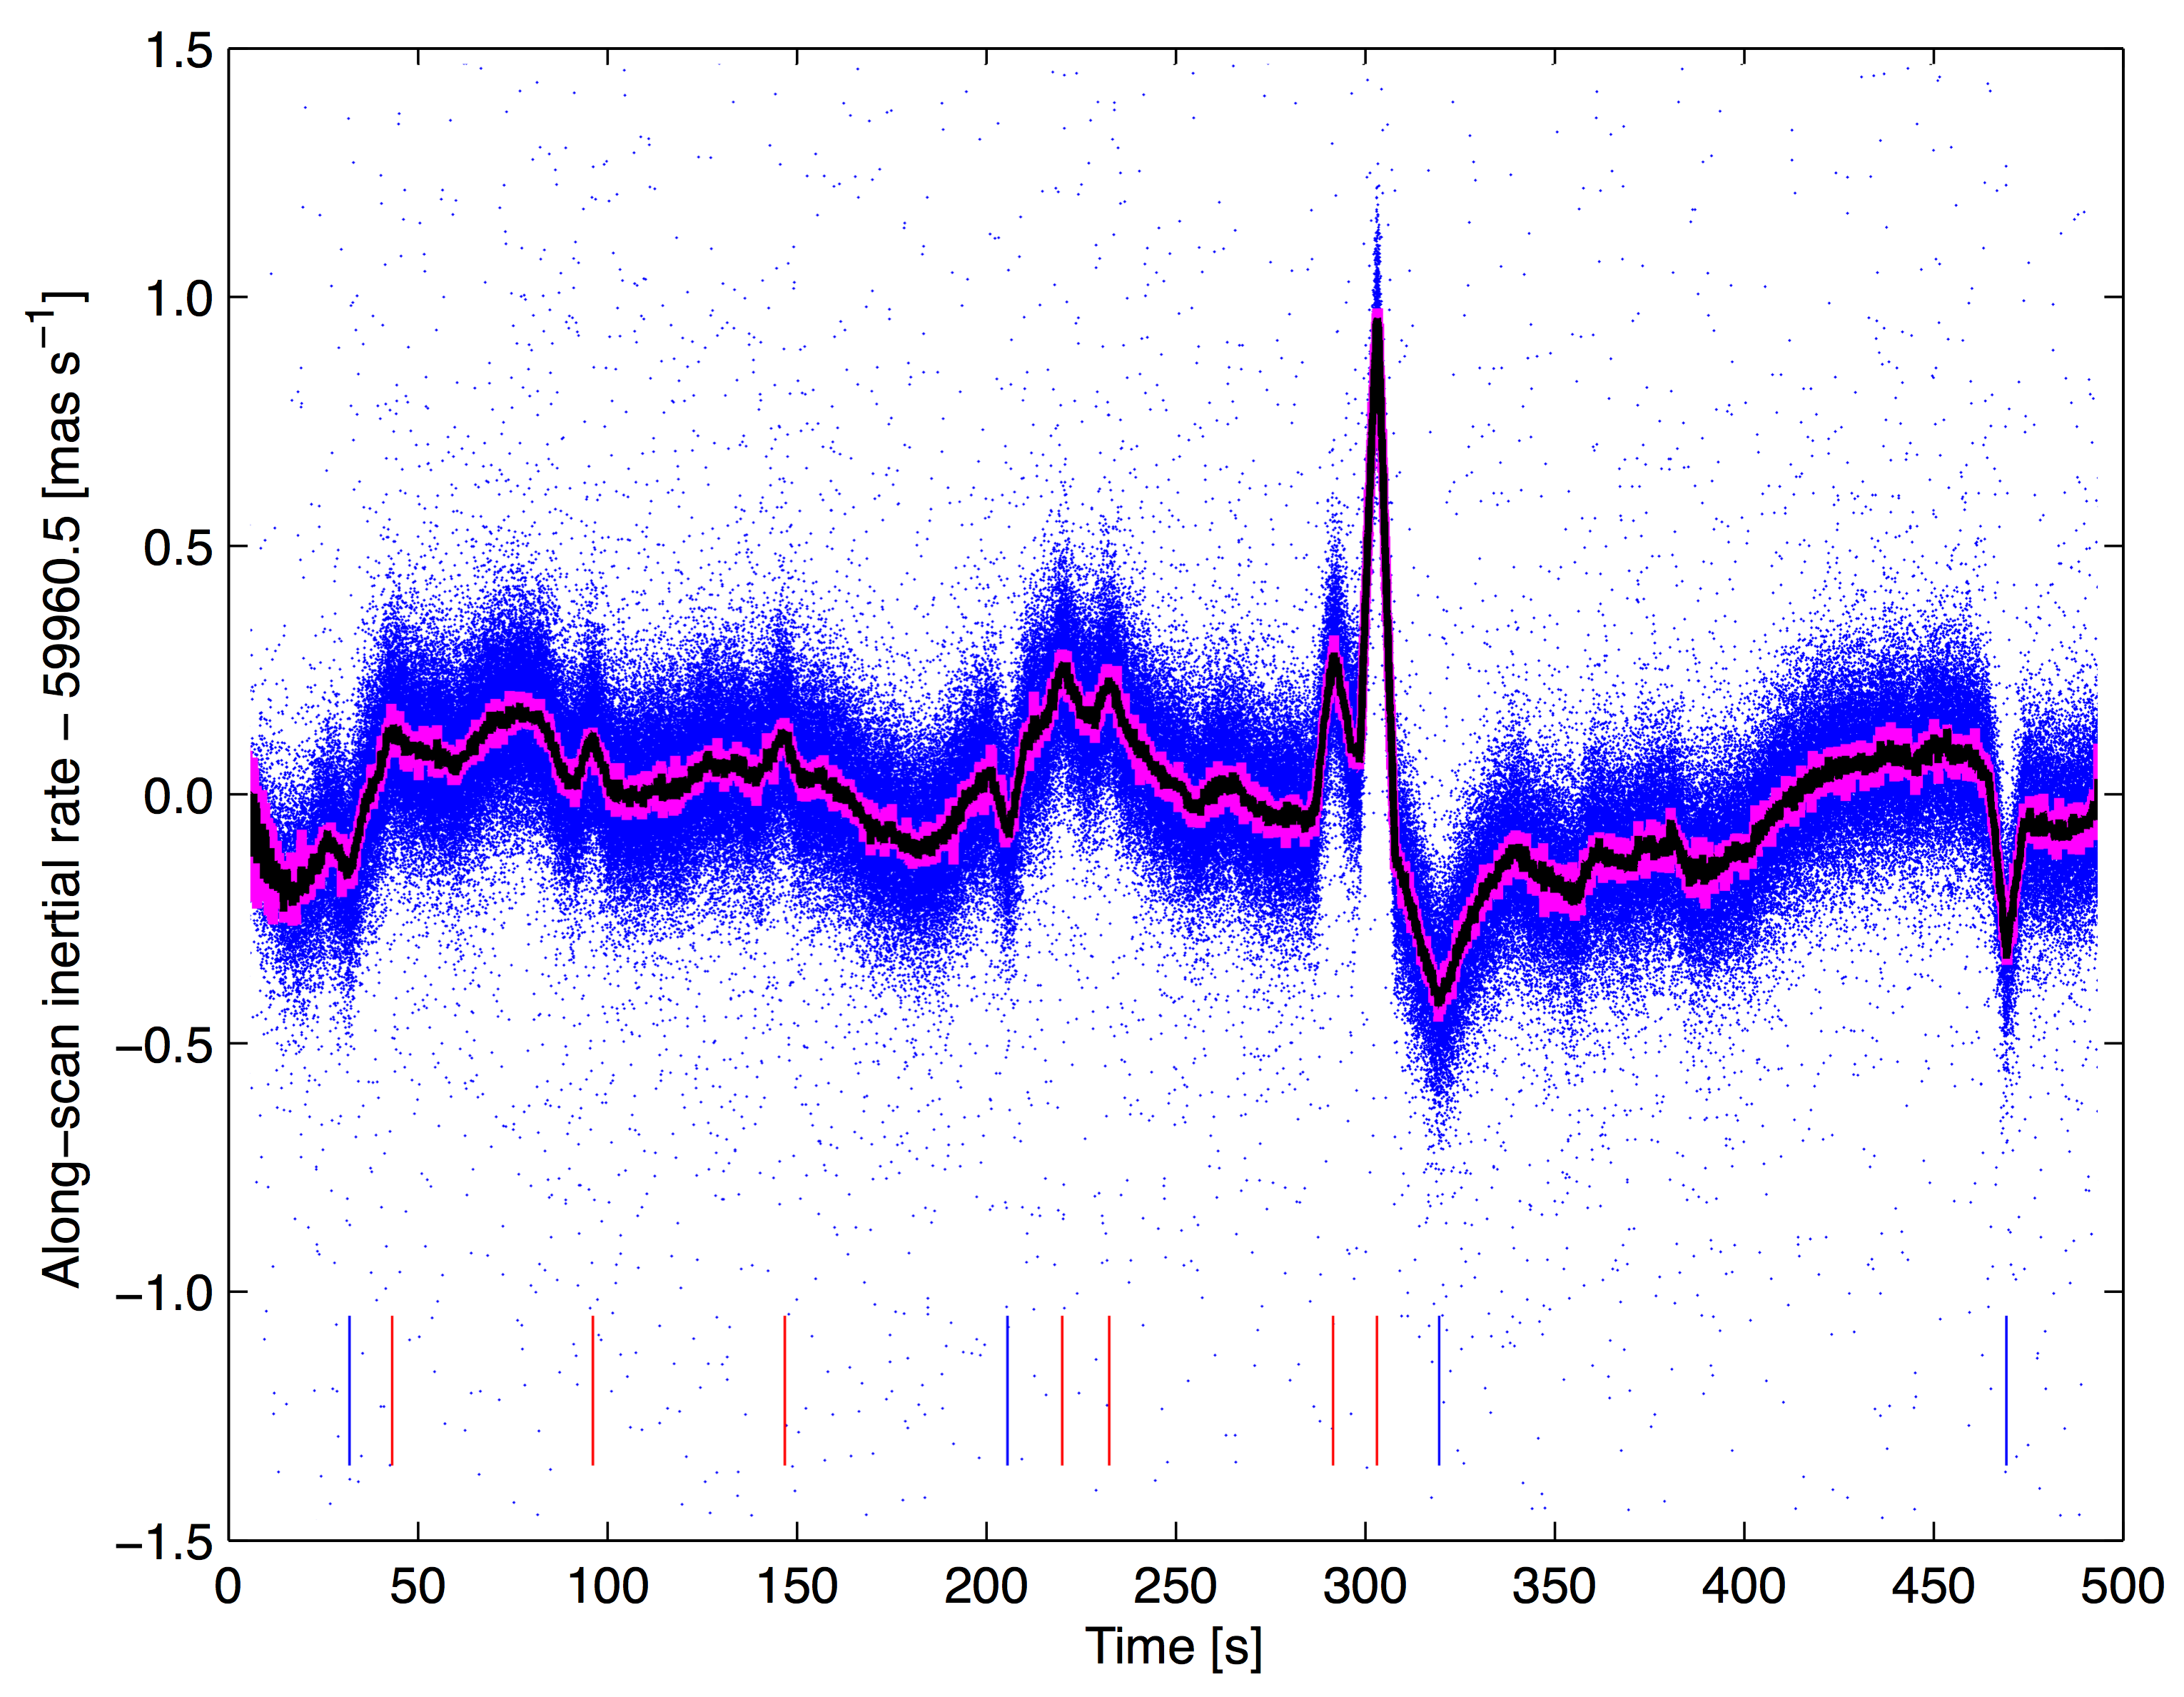
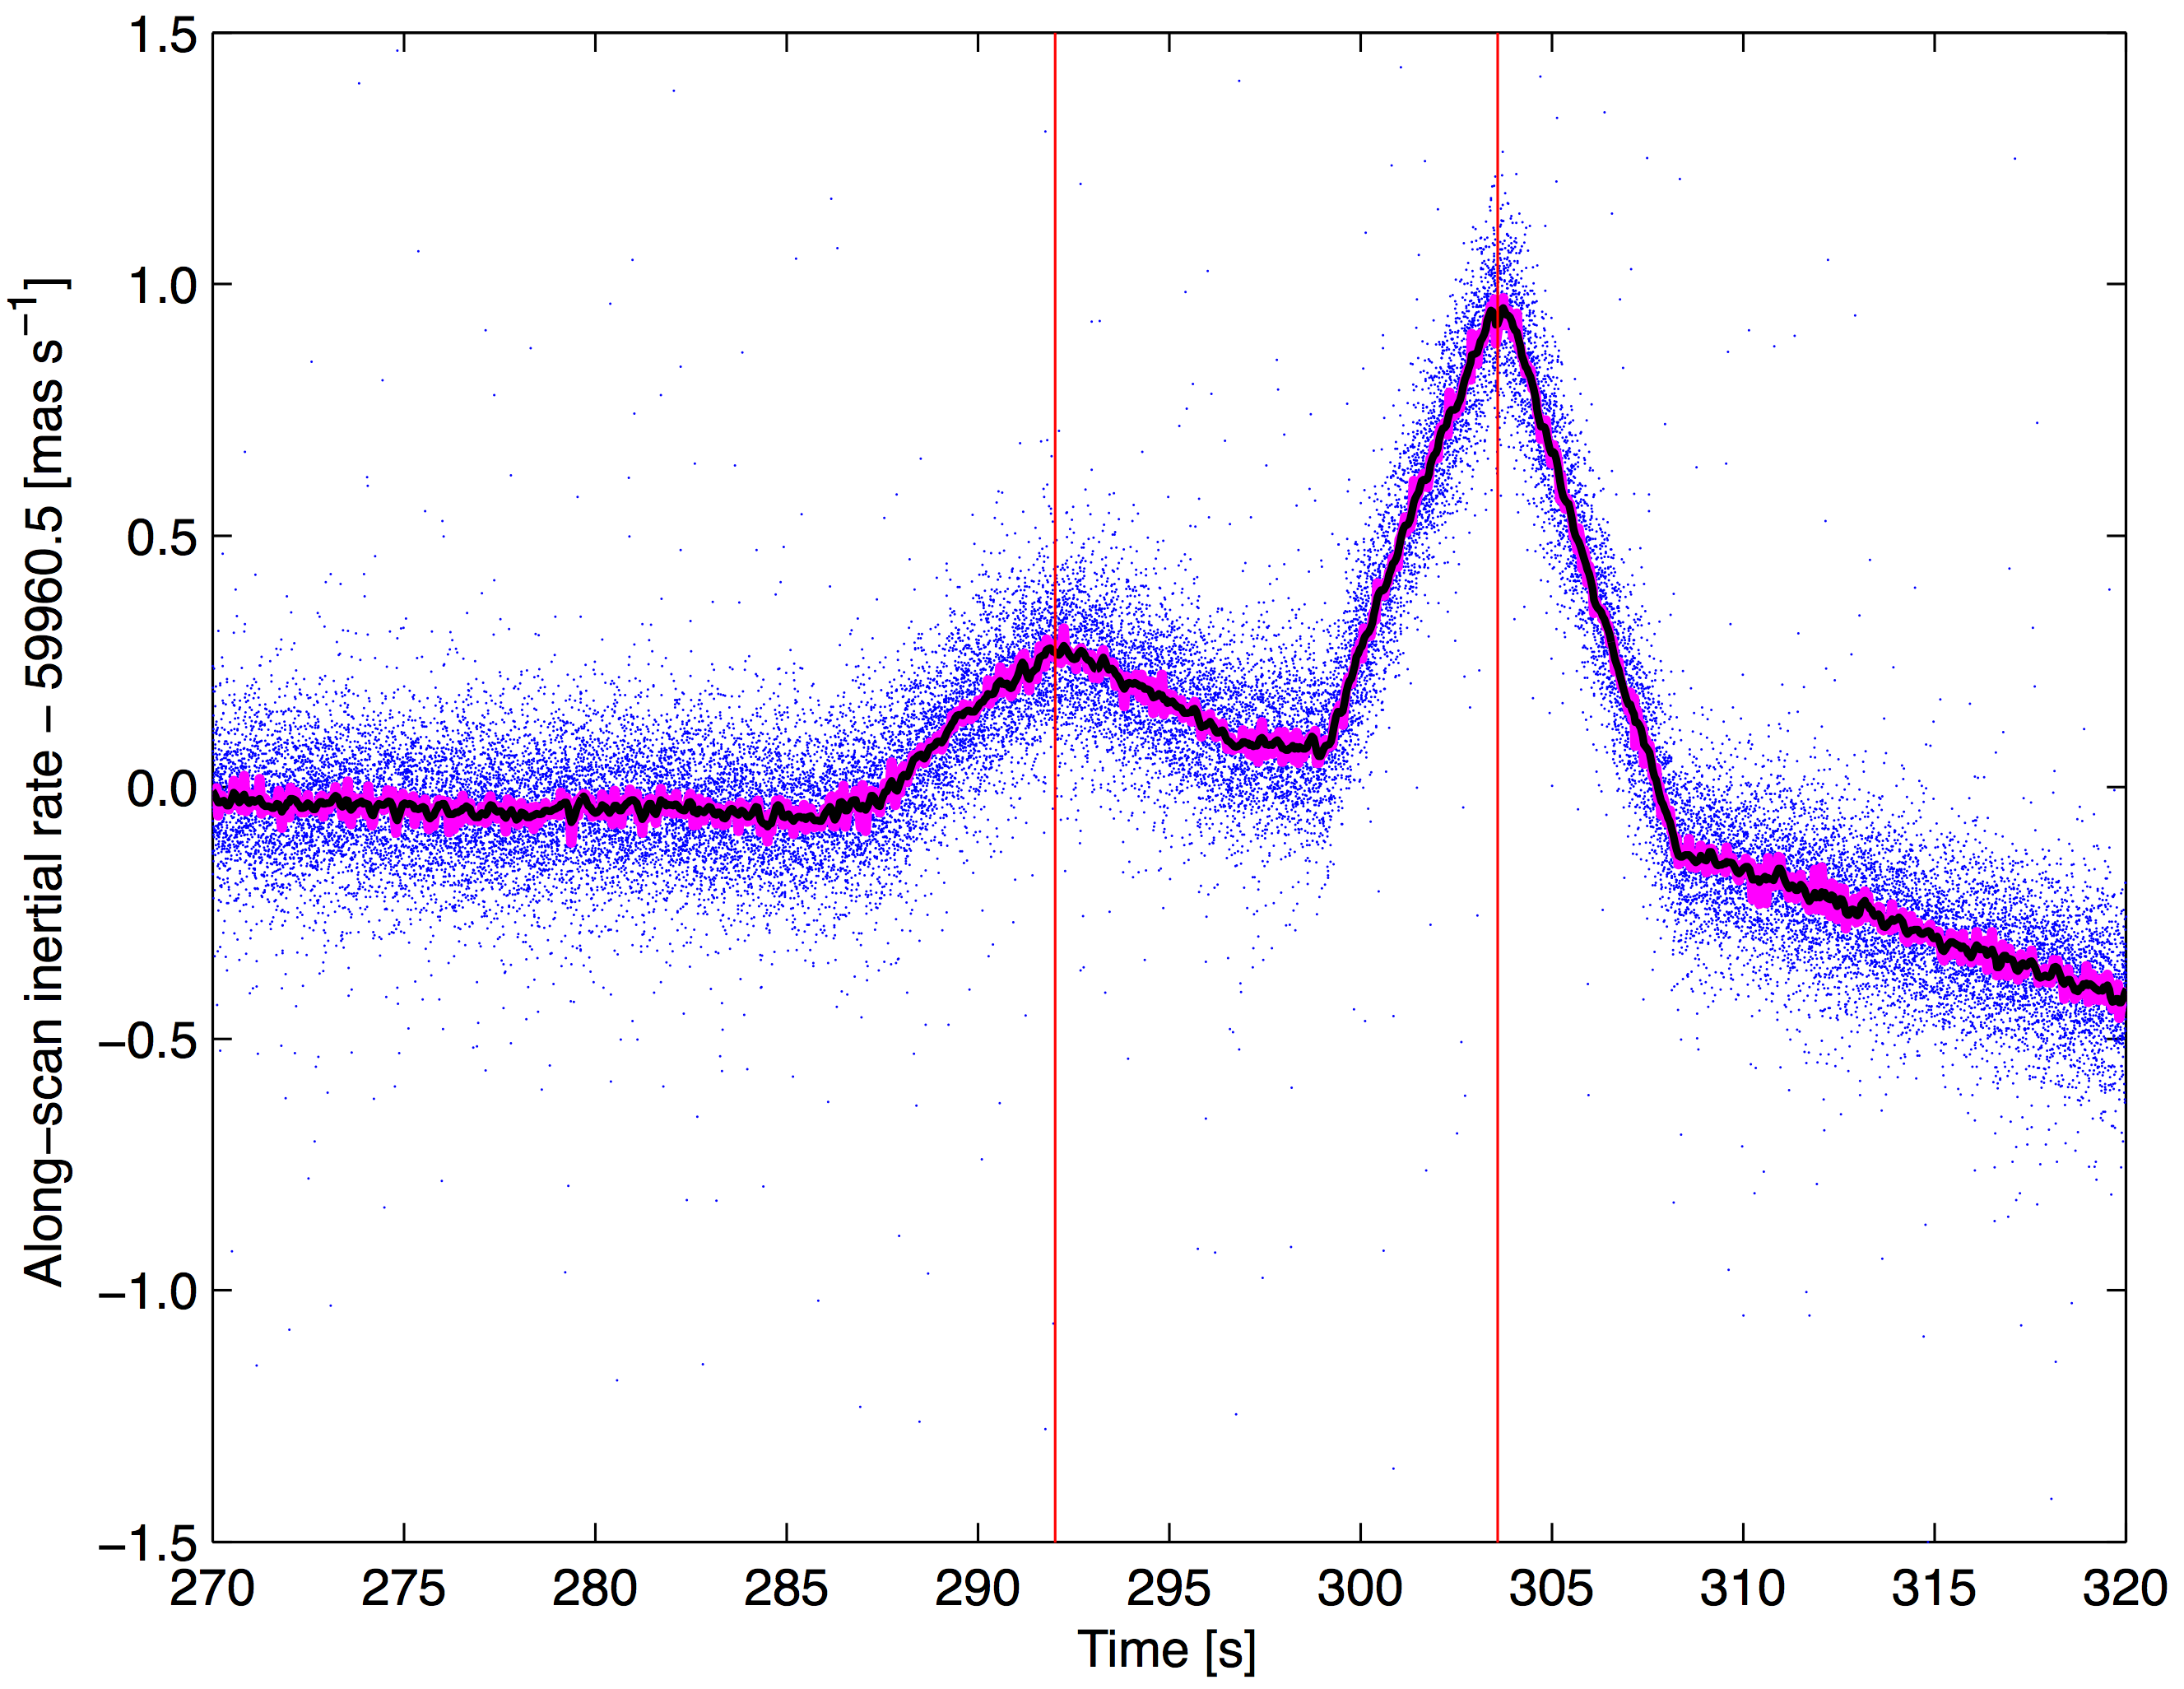
Fig. D.4

Top panels: examples of micro-clanks in the AL TGAS residuals during a time interval of 500 s (left) and a subinterval of 50 s (right). The vertical lines show the times of the micro-clanks as estimated from rate data (red/blue for positive/negative jumps). The attitude knot interval is 30 s, which sets the typical period of the wiggles seen between the micro-clanks. In the top right panel, filled blue dots are ungated observations and open red circles are gated observations. The shorter integration time of the gated observations gives a steeper slope of the residuals around the micro-clanks, as can be seen, for example, by comparing the open red circles and filled blue dots around the jump at 303 s in the top right panel. Bottom panels: AL inertial angular rates estimated from successive ungated CCD observations of a much larger number of faint (~15 mag) stars. Individual rate estimates are shown as blue dots. The thick magenta curve shows the median rate estimate in each bin of 0.045 s duration. The black curve is a 5-point running triangular mean of the medians, added to better show the rate variations. The vertical lines at the bottom of the diagram show the estimated times of the micro-clanks detected by means of a simple matched filter.
Current usage metrics show cumulative count of Article Views (full-text article views including HTML views, PDF and ePub downloads, according to the available data) and Abstracts Views on Vision4Press platform.
Data correspond to usage on the plateform after 2015. The current usage metrics is available 48-96 hours after online publication and is updated daily on week days.
Initial download of the metrics may take a while.