Fig. C.11
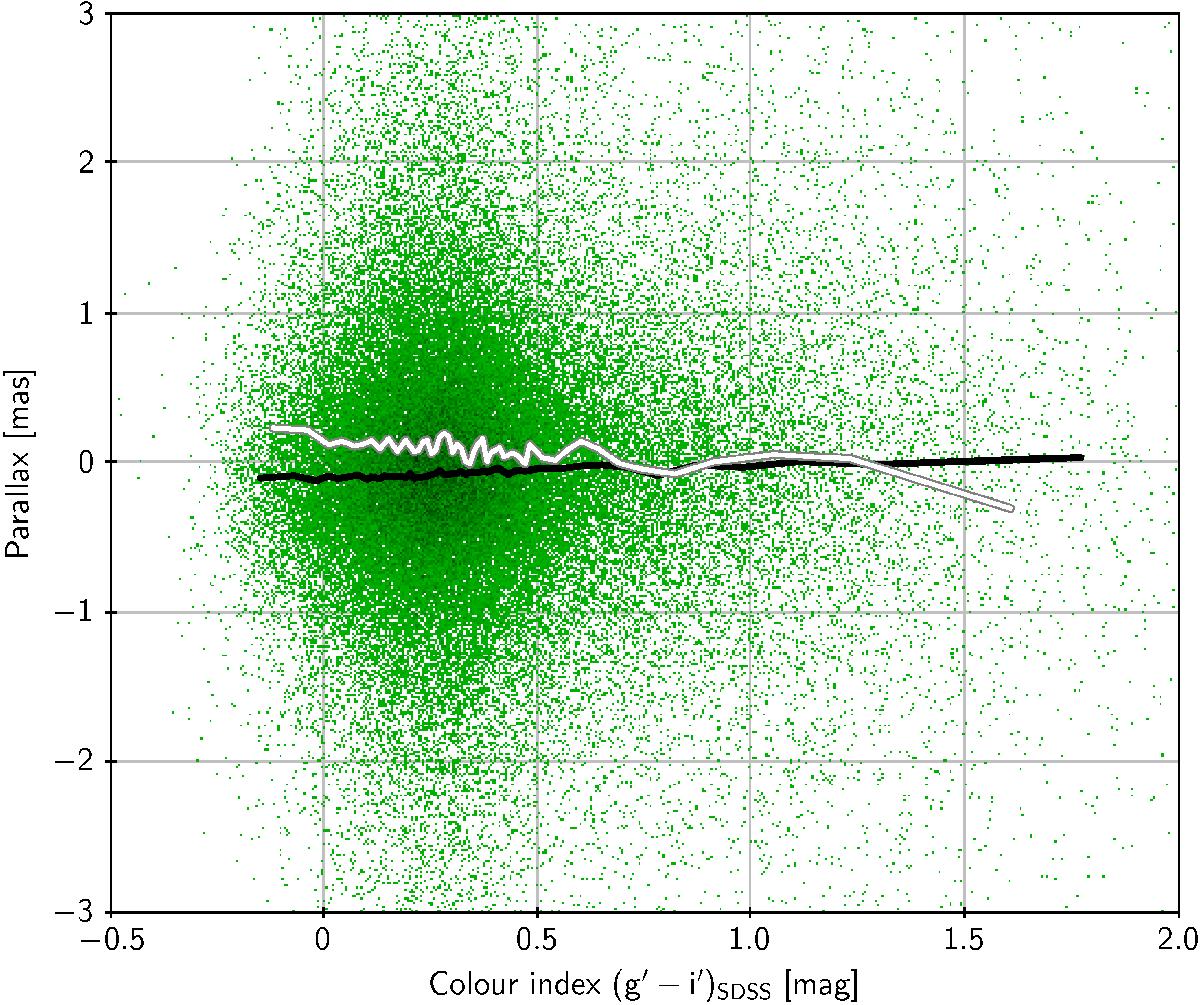
Measured parallaxes for 94 795 quasars plotted against SDSS colour index g′−i′. The black line is for northern (β> 0), the grey-white line for southern ecliptic latitudes (β< 0). The lines connect median values calculated in 50 bins subdividing the data according to g′−i′. Each bin contains about 1600 data points for the northern and 300 for the southern latitudes.
Current usage metrics show cumulative count of Article Views (full-text article views including HTML views, PDF and ePub downloads, according to the available data) and Abstracts Views on Vision4Press platform.
Data correspond to usage on the plateform after 2015. The current usage metrics is available 48-96 hours after online publication and is updated daily on week days.
Initial download of the metrics may take a while.