Open Access
Fig. C.8
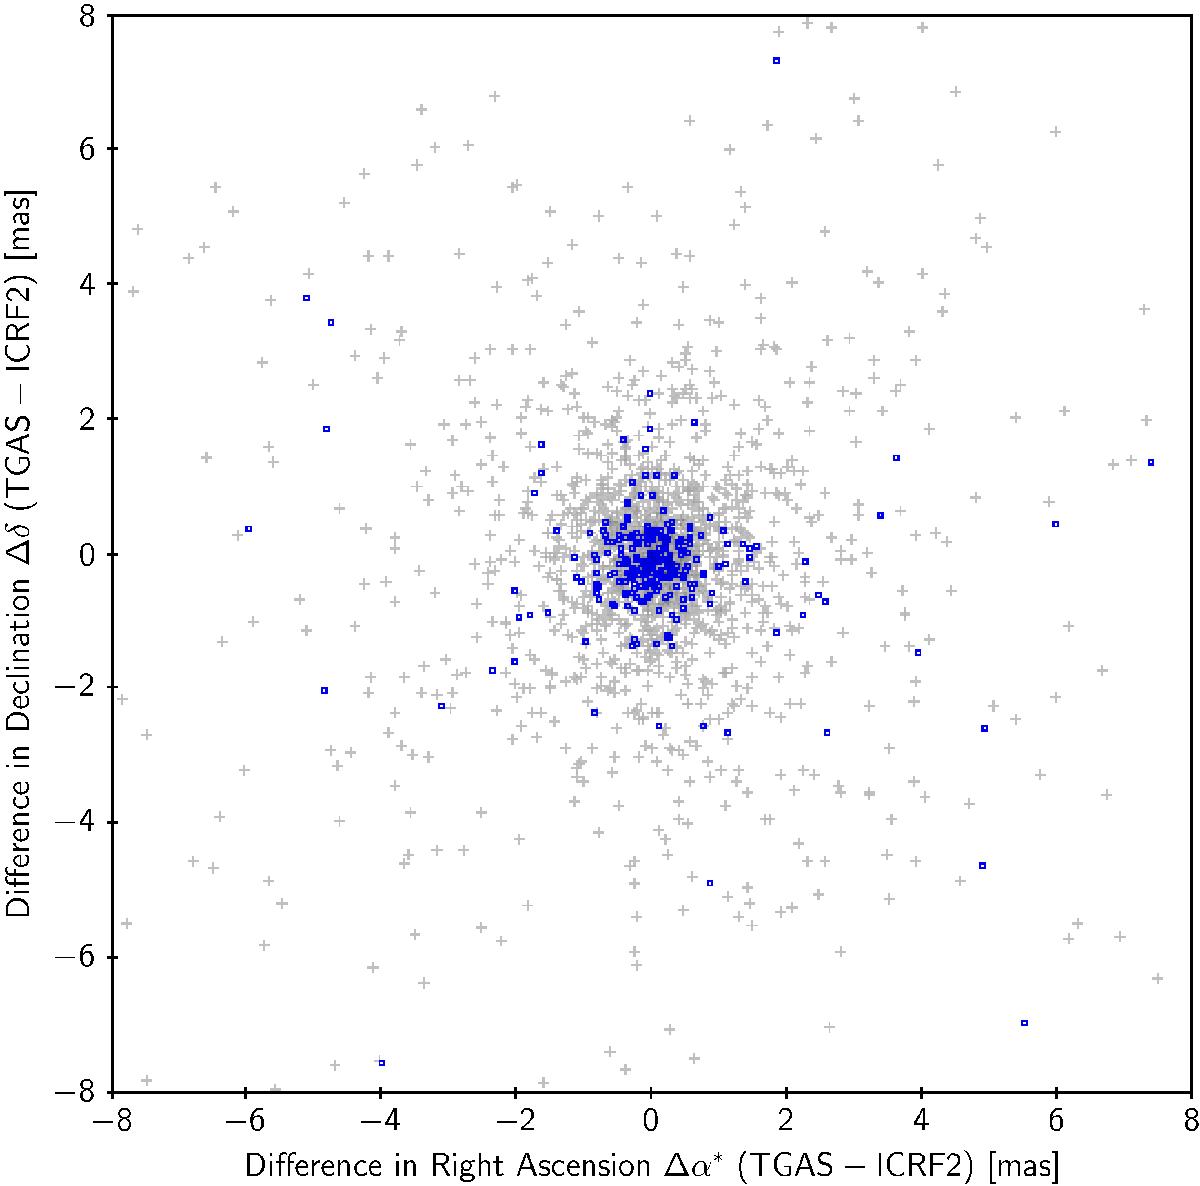
Positional offsets of the optical sources matched to the VLBI positions of ICRF2 sources. The blue circles are defining sources in ICRF2, the grey crosses non-defining sources. 2035 sources are inside the displayed area, 156 are outside.
Current usage metrics show cumulative count of Article Views (full-text article views including HTML views, PDF and ePub downloads, according to the available data) and Abstracts Views on Vision4Press platform.
Data correspond to usage on the plateform after 2015. The current usage metrics is available 48-96 hours after online publication and is updated daily on week days.
Initial download of the metrics may take a while.