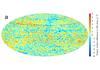
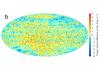
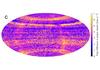
Fig. C.7

Differences in proper motion between the primary (TGAS) solution and the Tycho-2 catalogue for 1 997 003 sources: a) differences in μα ∗; b) differences in μδ; and c) total differences ![]() . Differences are taken in the sense TGAS minus Tycho-2, after rotation of the latter to the Gaia DR1 reference frame. Median differences are shown in cells of about 0.84 deg2. Some empty cells are shown in white. The maps use an Aitoff projection in equatorial (ICRS) coordinates, with origin α = δ = 0 at the centre and α increasing from right to left.
. Differences are taken in the sense TGAS minus Tycho-2, after rotation of the latter to the Gaia DR1 reference frame. Median differences are shown in cells of about 0.84 deg2. Some empty cells are shown in white. The maps use an Aitoff projection in equatorial (ICRS) coordinates, with origin α = δ = 0 at the centre and α increasing from right to left.
Current usage metrics show cumulative count of Article Views (full-text article views including HTML views, PDF and ePub downloads, according to the available data) and Abstracts Views on Vision4Press platform.
Data correspond to usage on the plateform after 2015. The current usage metrics is available 48-96 hours after online publication and is updated daily on week days.
Initial download of the metrics may take a while.