Open Access
Fig. C.3
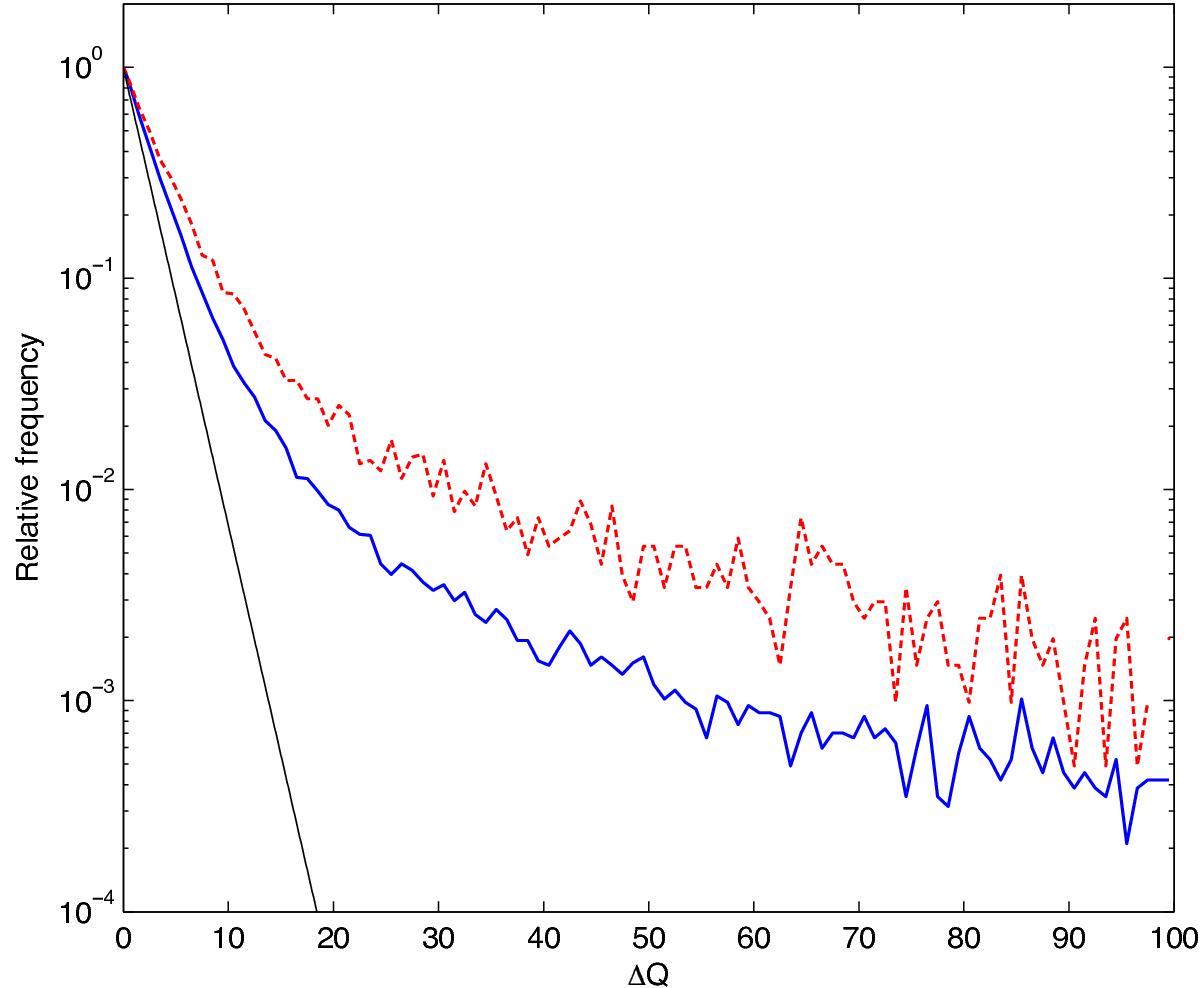
Relative frequencies of the statistic ΔQ for two selections of stars in the Hipparcos subset of the primary solution: 91 939 bona fide single stars (solid blue curve) and 9167 other stars (dashed red). The black line is the theoretically expected distribution.
Current usage metrics show cumulative count of Article Views (full-text article views including HTML views, PDF and ePub downloads, according to the available data) and Abstracts Views on Vision4Press platform.
Data correspond to usage on the plateform after 2015. The current usage metrics is available 48-96 hours after online publication and is updated daily on week days.
Initial download of the metrics may take a while.