Fig. 3
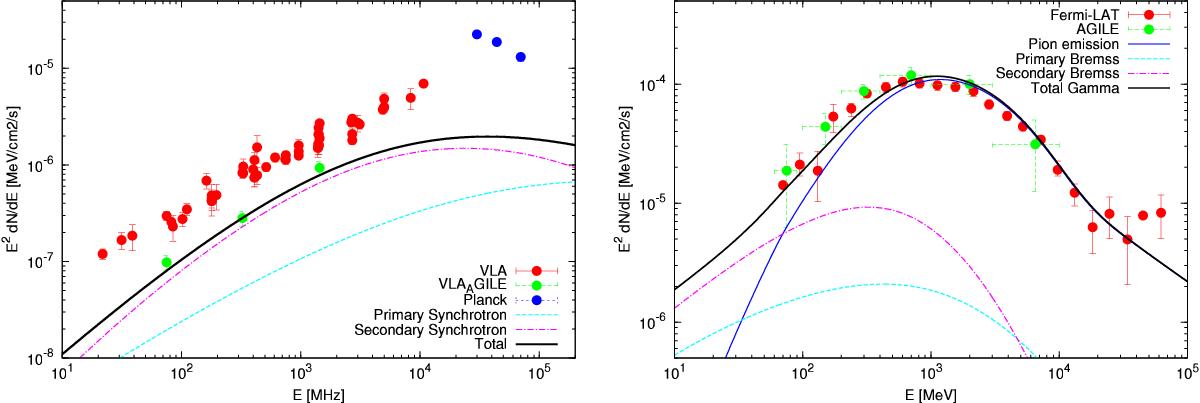
Left: VLA (red) and Planck (blue) radio data from the whole remnant (Castelletti et al. 2007; Planck Collaboration Int. XXXI 2016) and VLA radio data from the high-energy emitting region (green), plotted together with primary (cyan dashed line), secondary (magenta dot-dashed line), and total (black line) synchrotron radio emission obtained in our best fit reacceleration model. Right: AGILE (green) and Fermi-LAT (red) γ-ray points (Cardillo et al. 2014; Ackermann et al. 2013) plotted with γ-ray emission from pion decay (blue dotted line), emission due to bremsstrahlung of primary (cyan dashed line), and secondary (magenta dot-dashed line) electrons, and total emission (black line).
Current usage metrics show cumulative count of Article Views (full-text article views including HTML views, PDF and ePub downloads, according to the available data) and Abstracts Views on Vision4Press platform.
Data correspond to usage on the plateform after 2015. The current usage metrics is available 48-96 hours after online publication and is updated daily on week days.
Initial download of the metrics may take a while.