Fig. 1
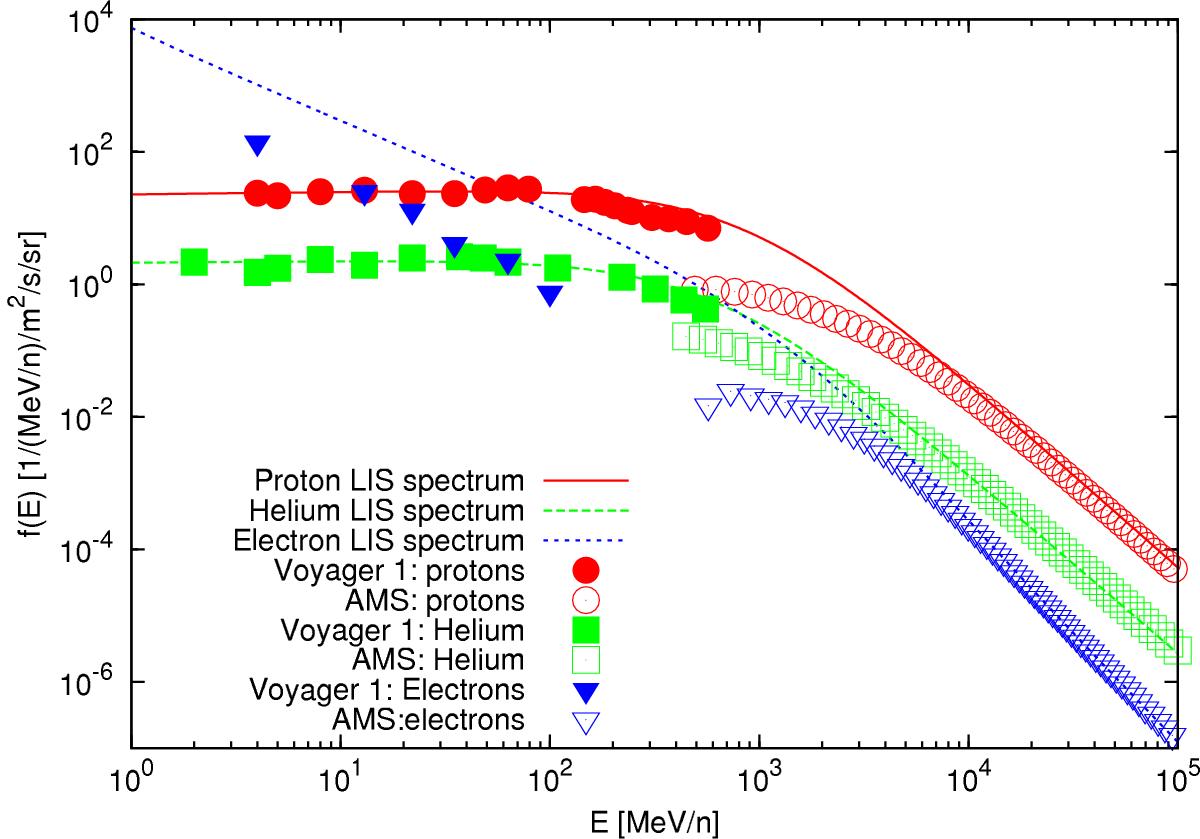
Protons (red), helium (green), and electrons (blue) spectra. Circles represent the data points of protons, squares electrons, and triangles helium; measurements from Voyager 1 (Potgieter 2014) are represented by filled points, whereas AMS measurements (Aguilar et al. 2015a,b,c) are represented by open points. The curves represent the fits to the LIS spectrum of the different species used in this work (Potgieter 2014). The blue curve does not go through the Voyager 1 data points because the electron data are those collected in 2010 when Voyager had not entered the HP yet.
Current usage metrics show cumulative count of Article Views (full-text article views including HTML views, PDF and ePub downloads, according to the available data) and Abstracts Views on Vision4Press platform.
Data correspond to usage on the plateform after 2015. The current usage metrics is available 48-96 hours after online publication and is updated daily on week days.
Initial download of the metrics may take a while.