Fig. 7
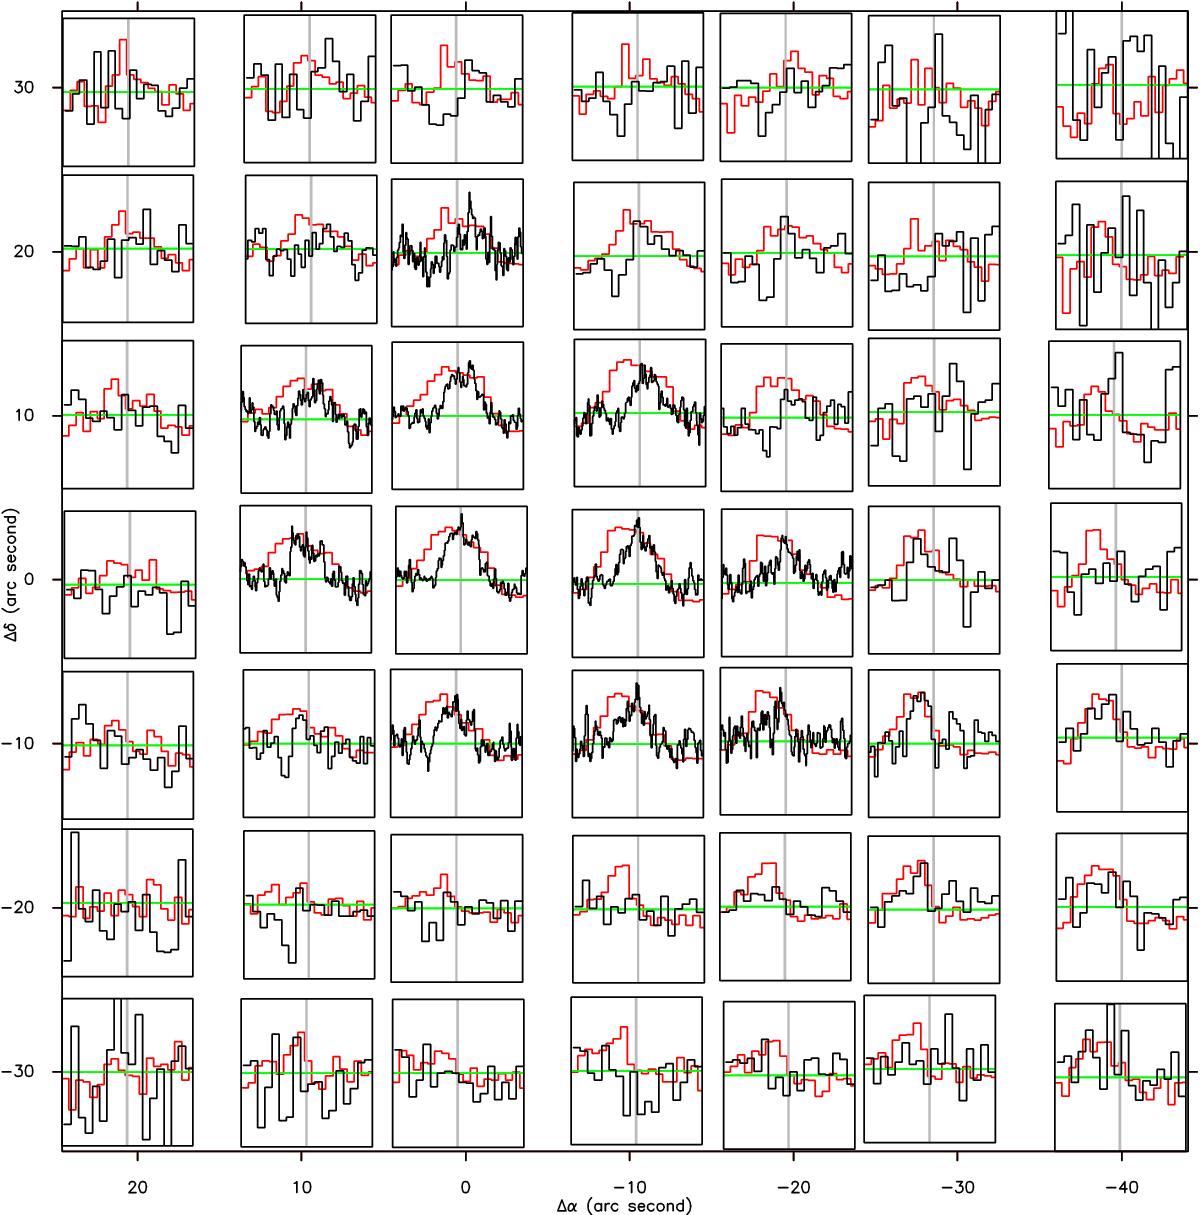
Map toward W43 MM1 of ![]() for p-H2O 111–000 (red) and p-H
for p-H2O 111–000 (red) and p-H![]() O 111–000 (black) in the velocity range [90 km s-1,110 km s-1]. The y-axis is from –0.1 to 1.1 for p-H2O 111–000, and p-H
O 111–000 (black) in the velocity range [90 km s-1,110 km s-1]. The y-axis is from –0.1 to 1.1 for p-H2O 111–000, and p-H![]() O 111–000 is scaled by 4. The horizontal green lines define the zero level. The vertical gray lines mark 100 km s-1. As the signal-to-noise ratio increases for decreasing Tcont, the spectra velocity resolution varies over the map in order to keep it at a minimum value. Hence, with the greatest Tcont, central spectra having a greater number of channels appear plotted darker than those with a lower Tcont. Axis units are offset (″) from MM1.
O 111–000 is scaled by 4. The horizontal green lines define the zero level. The vertical gray lines mark 100 km s-1. As the signal-to-noise ratio increases for decreasing Tcont, the spectra velocity resolution varies over the map in order to keep it at a minimum value. Hence, with the greatest Tcont, central spectra having a greater number of channels appear plotted darker than those with a lower Tcont. Axis units are offset (″) from MM1.
Current usage metrics show cumulative count of Article Views (full-text article views including HTML views, PDF and ePub downloads, according to the available data) and Abstracts Views on Vision4Press platform.
Data correspond to usage on the plateform after 2015. The current usage metrics is available 48-96 hours after online publication and is updated daily on week days.
Initial download of the metrics may take a while.