Fig. 6
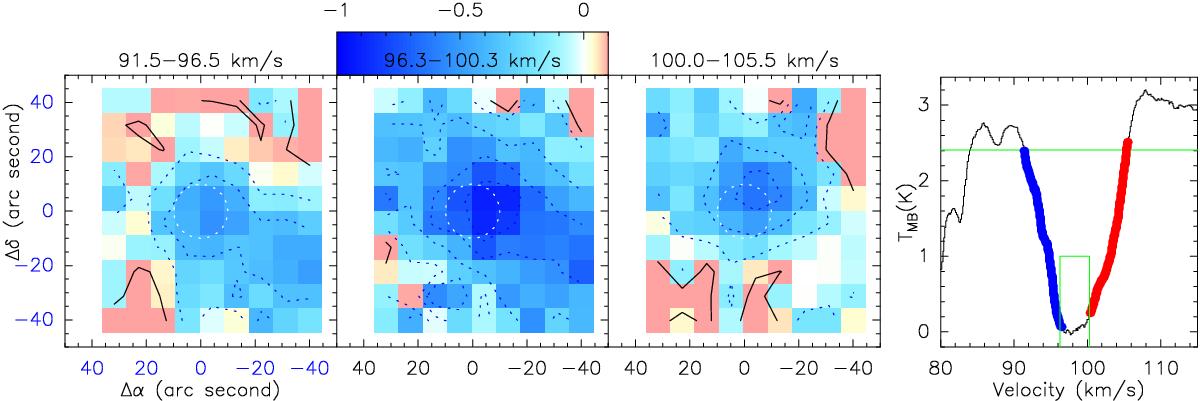
From left to right: maps of the average absorbed fraction ![]() of the main p-H2O 111–000 line blue wing, center, and red wing. Right: the (0, 0) spectrum as in Fig. 5 (in K), the blue and red wing ranges are color–coded. Other plot options are the same as in Fig. 5. These maps show that the blue wing material peaks southeast, whereas the red wing peaks north-northeast.
of the main p-H2O 111–000 line blue wing, center, and red wing. Right: the (0, 0) spectrum as in Fig. 5 (in K), the blue and red wing ranges are color–coded. Other plot options are the same as in Fig. 5. These maps show that the blue wing material peaks southeast, whereas the red wing peaks north-northeast.
Current usage metrics show cumulative count of Article Views (full-text article views including HTML views, PDF and ePub downloads, according to the available data) and Abstracts Views on Vision4Press platform.
Data correspond to usage on the plateform after 2015. The current usage metrics is available 48-96 hours after online publication and is updated daily on week days.
Initial download of the metrics may take a while.