Fig. 5
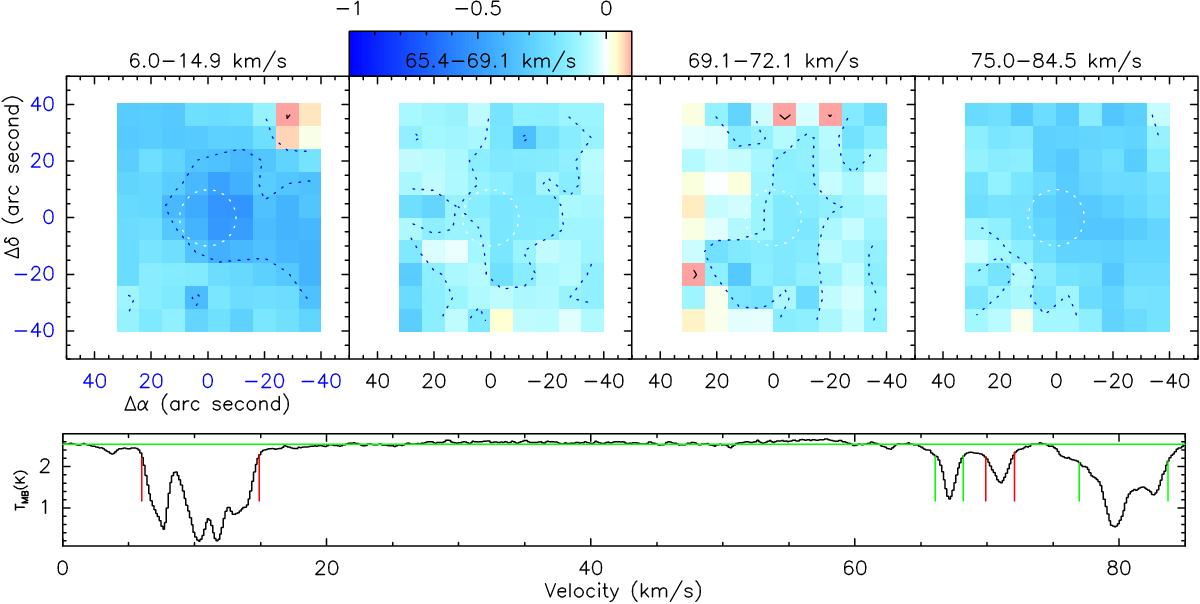
Maps of the p-H2O 111–000 average absorbed fraction ![]() in four velocity ranges bracketing the main four diffuse line of sight cold clouds. Velocity ranges are given above each box and are marked on the low signal-to-noise spectrum observed at (0, 0) by Herpin et al. (2012), the horizontal green line marks the continuum level (in K). The color scale is clipped in the range [–1, +0.1]. The white dashed circle stands for the beam at 1113 GHz at the (0, 0) position. These maps show an almost constant signal over all positions having a detectable continuum level. The MM1 core, located inside the beam circle is barely visible.
in four velocity ranges bracketing the main four diffuse line of sight cold clouds. Velocity ranges are given above each box and are marked on the low signal-to-noise spectrum observed at (0, 0) by Herpin et al. (2012), the horizontal green line marks the continuum level (in K). The color scale is clipped in the range [–1, +0.1]. The white dashed circle stands for the beam at 1113 GHz at the (0, 0) position. These maps show an almost constant signal over all positions having a detectable continuum level. The MM1 core, located inside the beam circle is barely visible.
Current usage metrics show cumulative count of Article Views (full-text article views including HTML views, PDF and ePub downloads, according to the available data) and Abstracts Views on Vision4Press platform.
Data correspond to usage on the plateform after 2015. The current usage metrics is available 48-96 hours after online publication and is updated daily on week days.
Initial download of the metrics may take a while.