Fig. 10
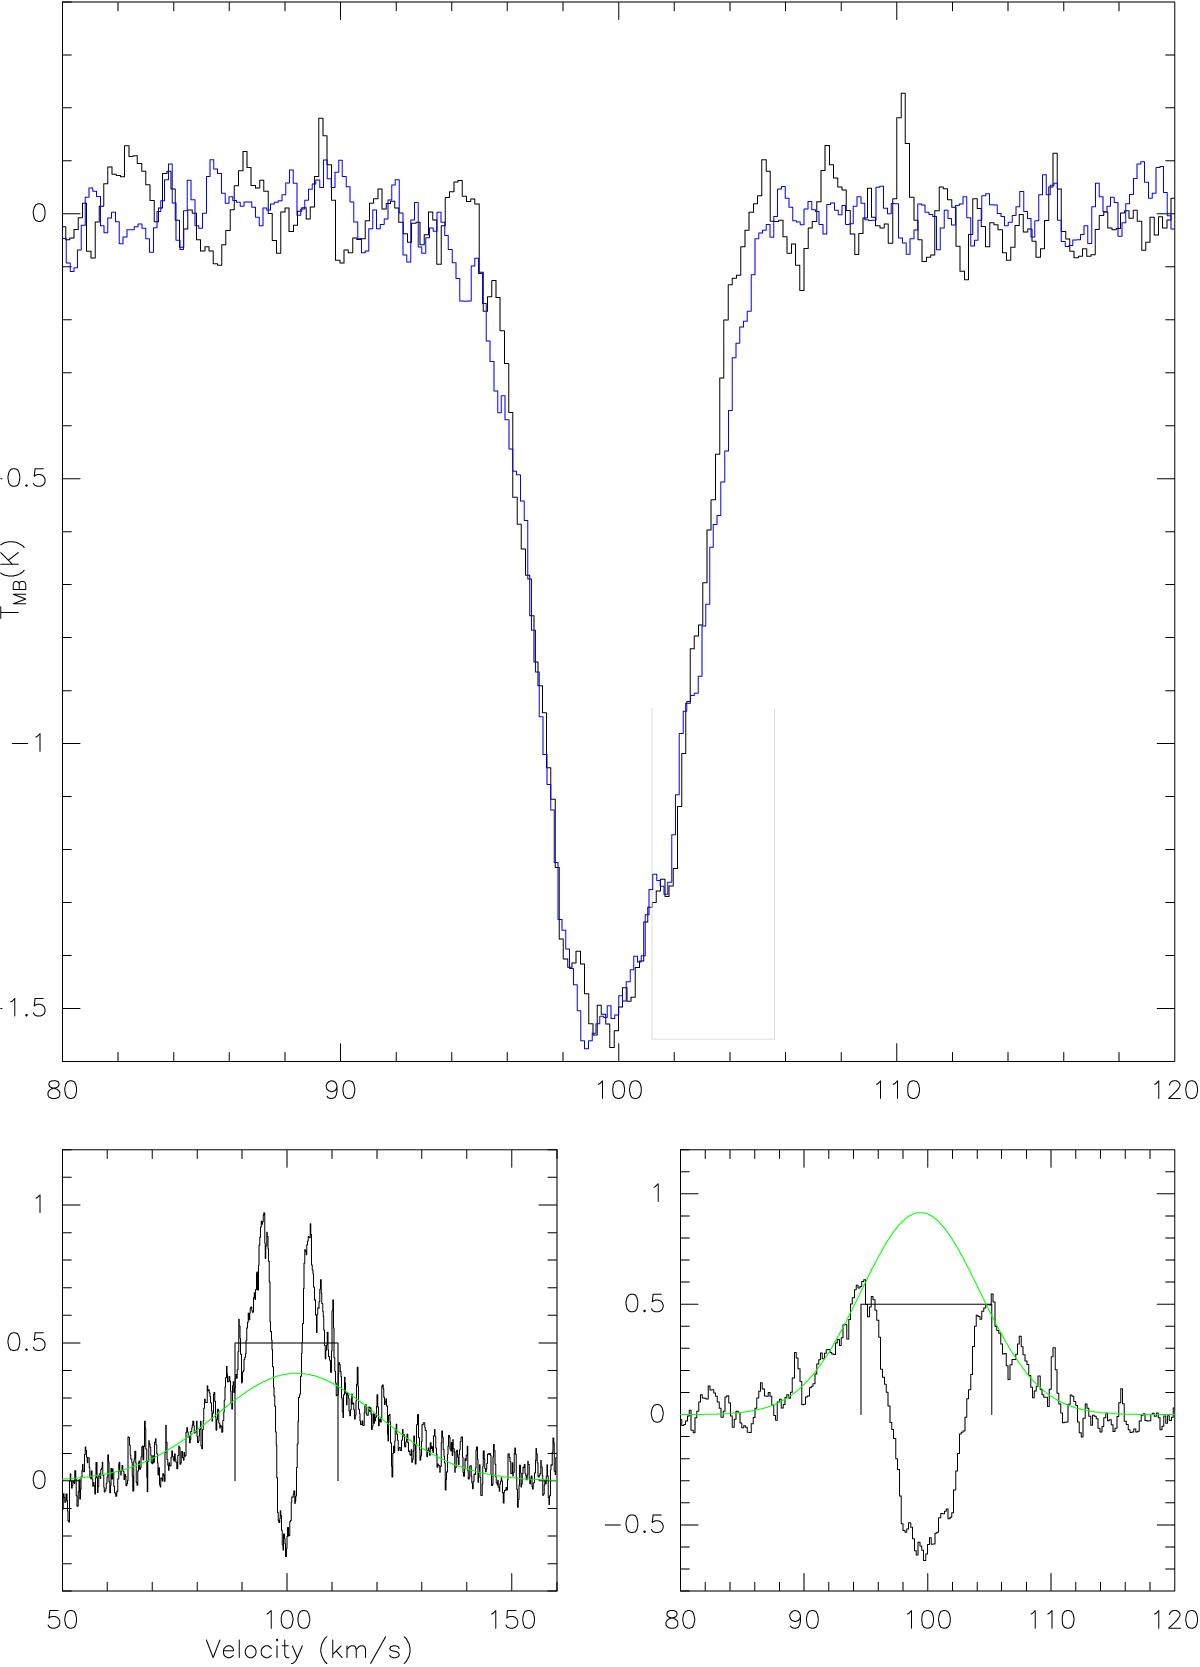
Absorption of p-H![]() O 111–000 versus p-H2O 202–111 (continuum level subtracted) after removal of a wide component and then a narrow Gaussian component. The wide component is fitted in the lower left box. The removed wide spectrum is shown in the lower right box with a fit of the narrow component. The upper box shows the final result where the p-H
O 111–000 versus p-H2O 202–111 (continuum level subtracted) after removal of a wide component and then a narrow Gaussian component. The wide component is fitted in the lower left box. The removed wide spectrum is shown in the lower right box with a fit of the narrow component. The upper box shows the final result where the p-H![]() O 111–000 spectrum intensity is scaled to the absorption level of p-H2O 111–000. This shows the high similarity of both profiles. Intensities are in K in all boxes.
O 111–000 spectrum intensity is scaled to the absorption level of p-H2O 111–000. This shows the high similarity of both profiles. Intensities are in K in all boxes.
Current usage metrics show cumulative count of Article Views (full-text article views including HTML views, PDF and ePub downloads, according to the available data) and Abstracts Views on Vision4Press platform.
Data correspond to usage on the plateform after 2015. The current usage metrics is available 48-96 hours after online publication and is updated daily on week days.
Initial download of the metrics may take a while.