Fig. 23
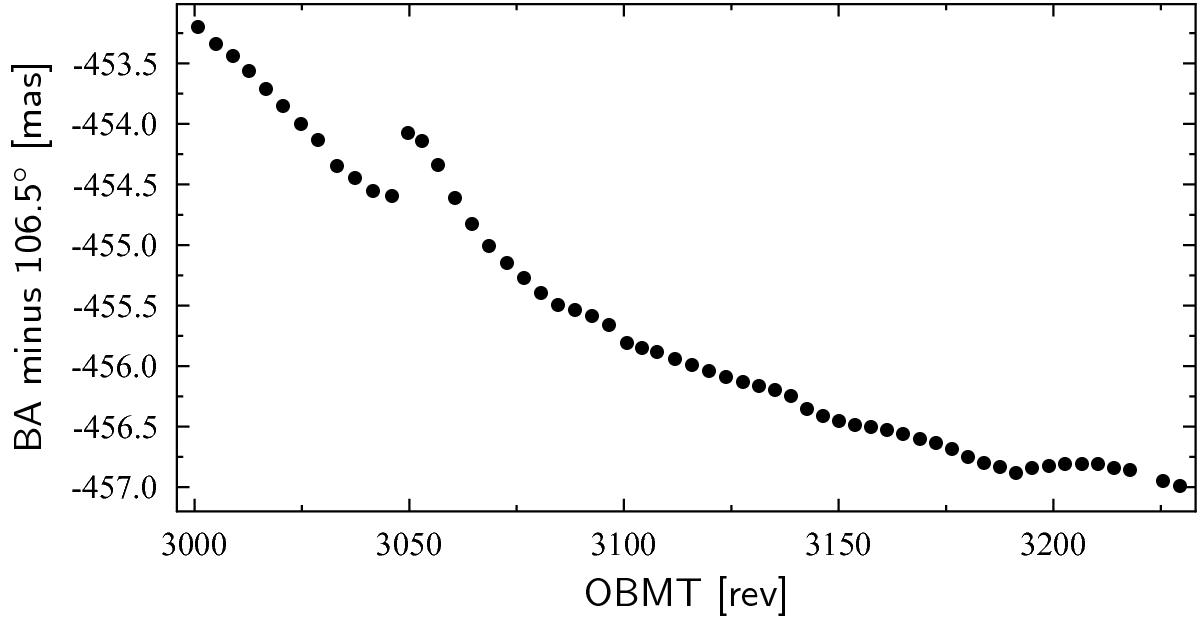
Long-term trend of the ODAS-derived basic angle (BA) over two months of mission time. The ODAS determines the mean angular location of each CCD in each field of view with micro-arcsecond precision every day (the basic-angle oscillations shown in e.g. Fig. 19 are averaged out in the process), from which an absolute basic angle can be derived (the BAM performs only relative angular measurements). The plot reveals a harmless general gradient of the order of 1–2 mas per month, which corresponds to a relative movement of the edges of the main mirrors of the two telescopes by just a few nanometers per month. This trend is presumably due to seasonal temperature variations (caused by the eccentricity of the Earth orbit; the levelling-off of the curve at right coincides with the approach to the perihelion) and to ageing of materials in the space environment. The obvious jump and subsequent relaxation is caused by a thermal disturbance due to an unplanned 17-h switch-off of the onboard payload data handling unit on November 29, 2015. Some of the smaller wiggles in the curve can also be traced to variable onboard conditions, such as e.g. a varying star density on the sky scanned by Gaia.
Current usage metrics show cumulative count of Article Views (full-text article views including HTML views, PDF and ePub downloads, according to the available data) and Abstracts Views on Vision4Press platform.
Data correspond to usage on the plateform after 2015. The current usage metrics is available 48-96 hours after online publication and is updated daily on week days.
Initial download of the metrics may take a while.