Fig. 22
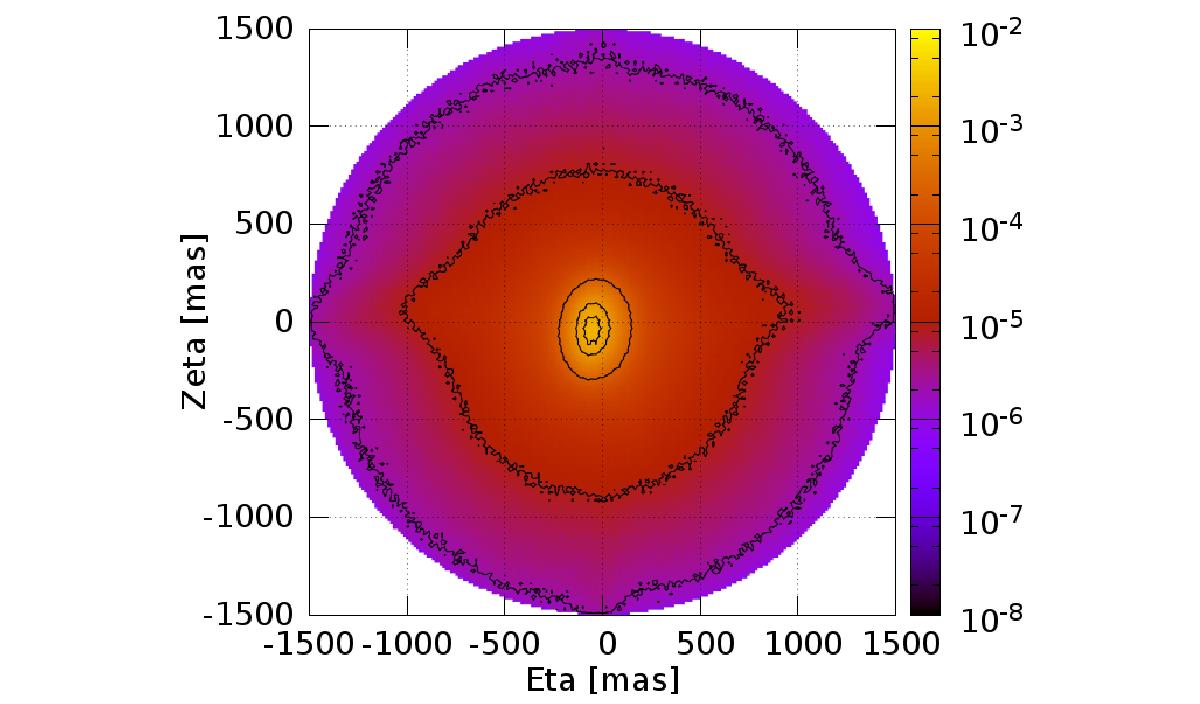
Two-dimensional histogram showing the distribution of the match distances between detected positions and their corresponding catalogue sources, for the AL and AC field angles (η and ζ, respectively). Contour lines are also shown, which help detecting features in the data or issues in the instrument or in the data processing.
Current usage metrics show cumulative count of Article Views (full-text article views including HTML views, PDF and ePub downloads, according to the available data) and Abstracts Views on Vision4Press platform.
Data correspond to usage on the plateform after 2015. The current usage metrics is available 48-96 hours after online publication and is updated daily on week days.
Initial download of the metrics may take a while.