Fig. 19
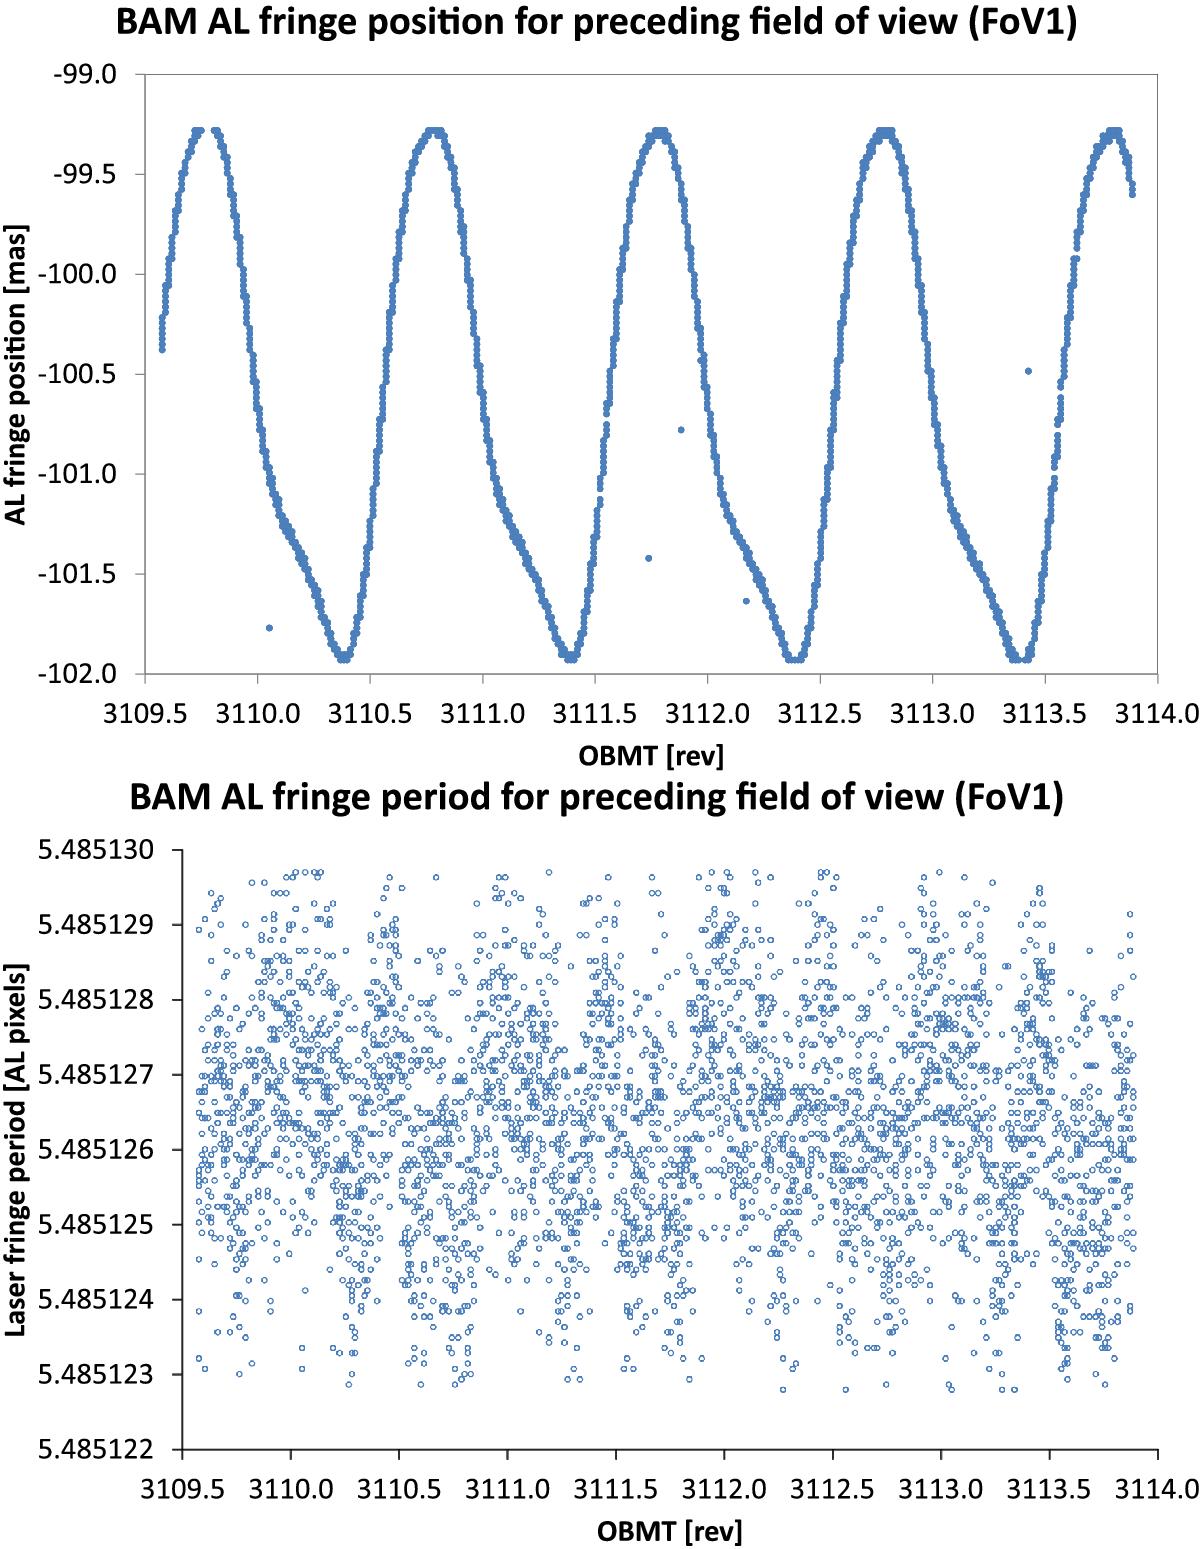
BAM daily First-Look analysis. The BAM data quality is monitored on a daily basis using several metrics implemented in the First-Look system. The top panel shows the evolution of the fringe phase for the preceding field of view during four spacecraft revolutions beginning on 2015-12-15. The significant (≈1 mas) amplitude of the periodic variations is apparent. The bottom panel shows the evolution of a secondary (nuisance) parameter, namely the average fringe period, during the same interval (≈1 ppm variability in this case). The plots include average values computed by First Look but have been adapted for better visualisation.
Current usage metrics show cumulative count of Article Views (full-text article views including HTML views, PDF and ePub downloads, according to the available data) and Abstracts Views on Vision4Press platform.
Data correspond to usage on the plateform after 2015. The current usage metrics is available 48-96 hours after online publication and is updated daily on week days.
Initial download of the metrics may take a while.