Free Access
Fig. 16
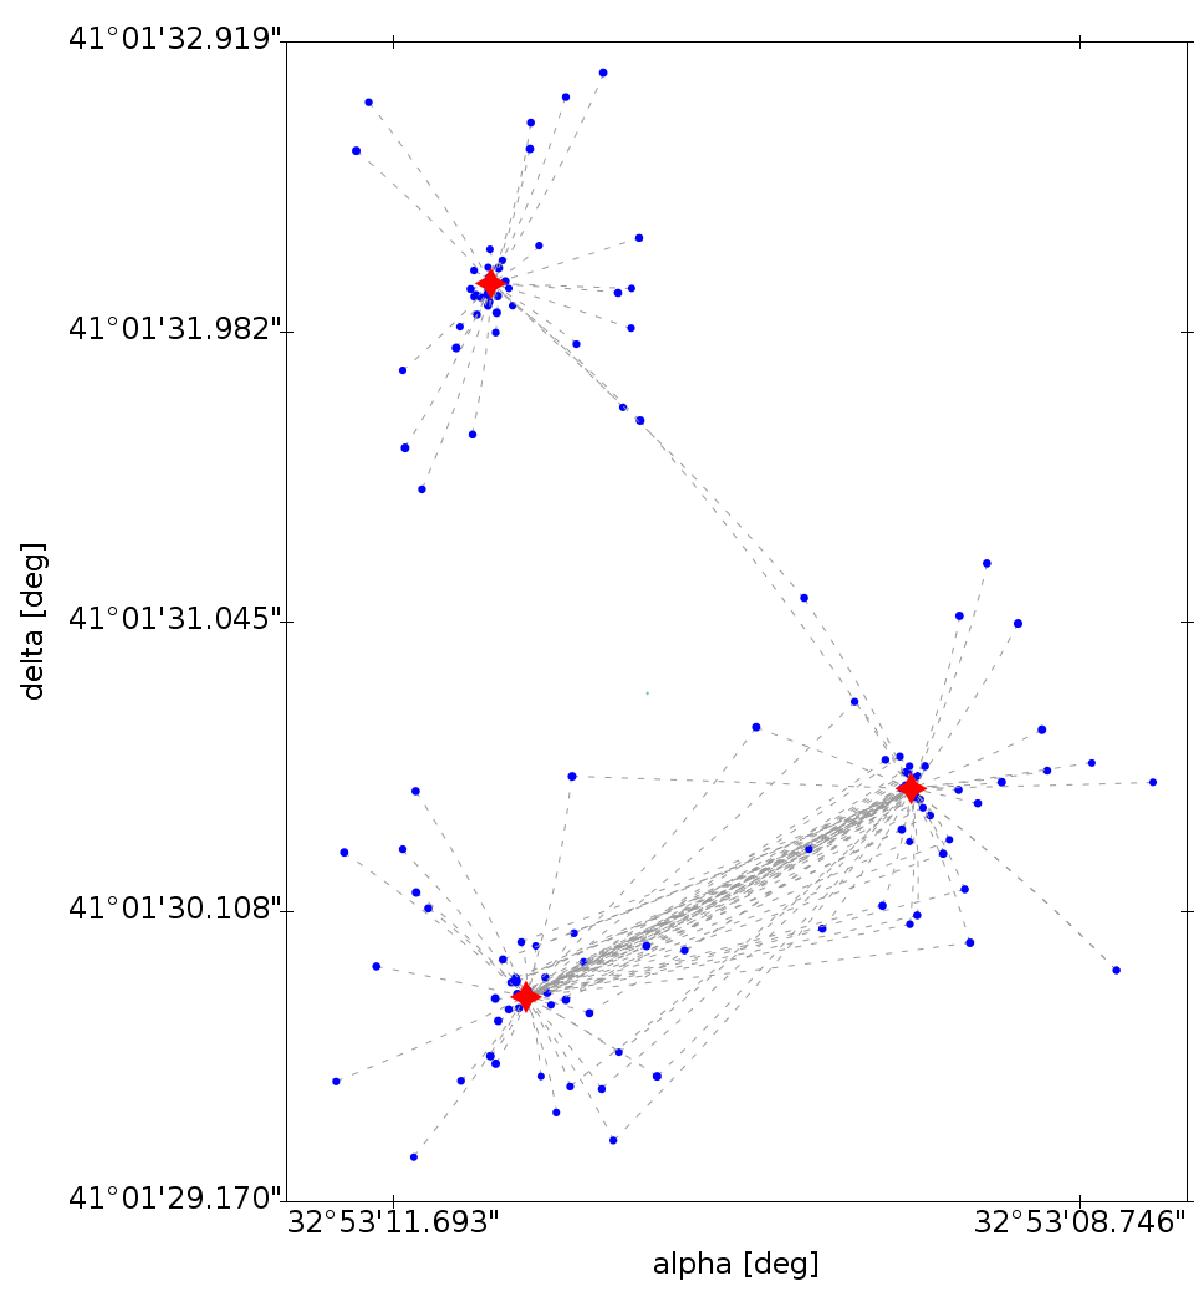
Example of a match candidate group; in this case comprising three catalogue sources and about 180 observations. Blue dots correspond to observations, red dots are sources, and the dashed lines represent the match candidate source links.
Current usage metrics show cumulative count of Article Views (full-text article views including HTML views, PDF and ePub downloads, according to the available data) and Abstracts Views on Vision4Press platform.
Data correspond to usage on the plateform after 2015. The current usage metrics is available 48-96 hours after online publication and is updated daily on week days.
Initial download of the metrics may take a while.