Fig. 7
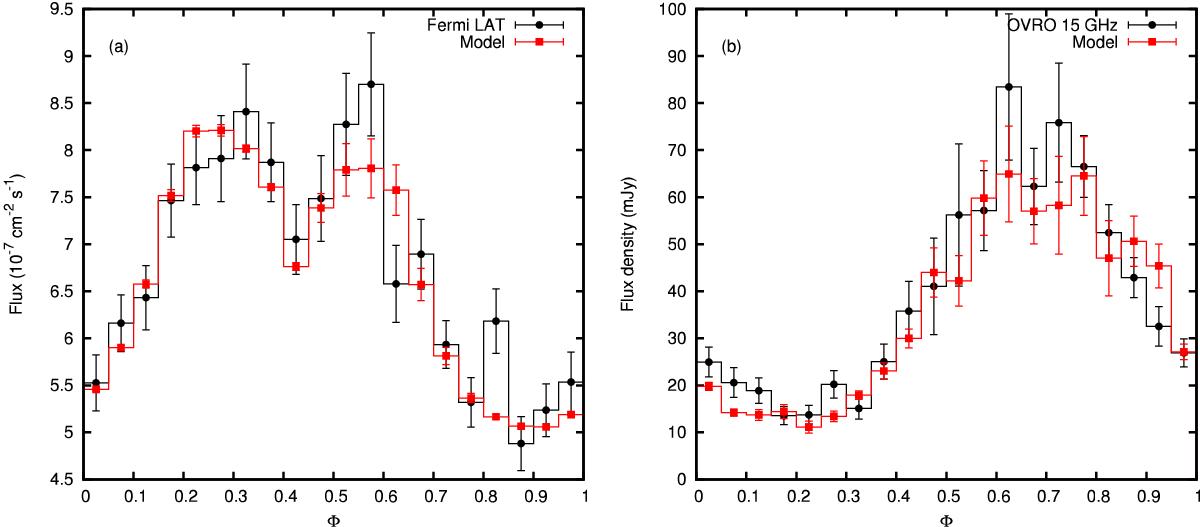
Results of the model in comparison with the observations. a) Comparison of the model GeV output (red) with the observations by the Fermi-LAT (black), the energy range is 0.1−3.0 GeV in both cases and the time interval is MJD 54 682−57450. The observed Fermi-LAT light curve, here folded on the orbital period P1 = 26.4960 days, shows two peaks. Assuming two electron injections along the orbit, the shape of the orbital modulation of this observed GeV light curve is reproduced. b) Comparison of the model radio output (red) with the observations by OVRO (black), both at 15 GHz spanning the time interval MJD 54 909−56 794. The observed light curve, folded on the orbital period P1, shows only one peak along the orbit. The model reproduces this characteristic apastron peak even though two electron injections are taken into account.
Current usage metrics show cumulative count of Article Views (full-text article views including HTML views, PDF and ePub downloads, according to the available data) and Abstracts Views on Vision4Press platform.
Data correspond to usage on the plateform after 2015. The current usage metrics is available 48-96 hours after online publication and is updated daily on week days.
Initial download of the metrics may take a while.