Fig. 6
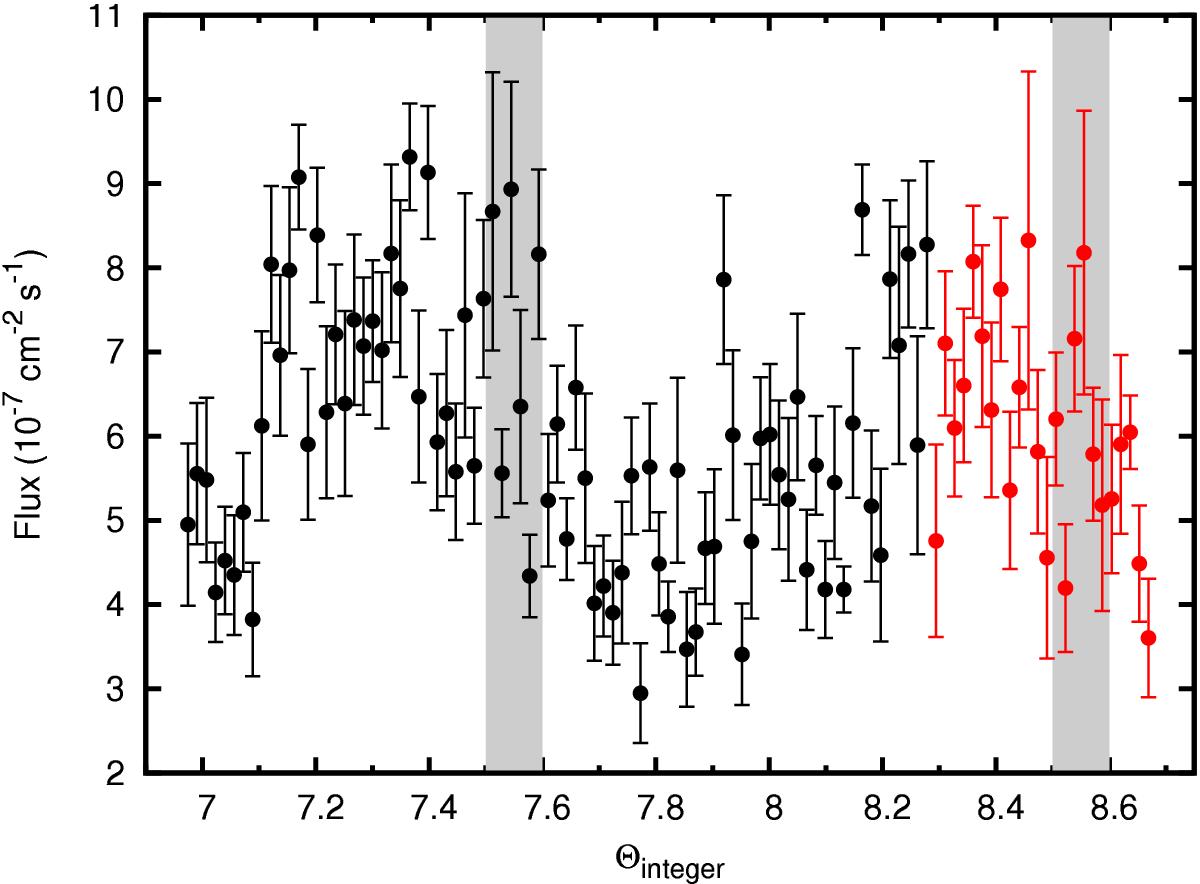
All Fermi-LAT data from the orbital phase interval Φ = 0.5−1.0, i.e. apastron vs. [(t−t0)/1626]. Data up to MJD 56 838 (the time interval in Jaron & Massi 2014) are plotted in black; data newer than that appear in red. The long-term amplitude modulation is clearly visible. The two grey areas indicate the Θ intervals that are removed from the data for the analysis of this paper.
Current usage metrics show cumulative count of Article Views (full-text article views including HTML views, PDF and ePub downloads, according to the available data) and Abstracts Views on Vision4Press platform.
Data correspond to usage on the plateform after 2015. The current usage metrics is available 48-96 hours after online publication and is updated daily on week days.
Initial download of the metrics may take a while.