Fig. 5
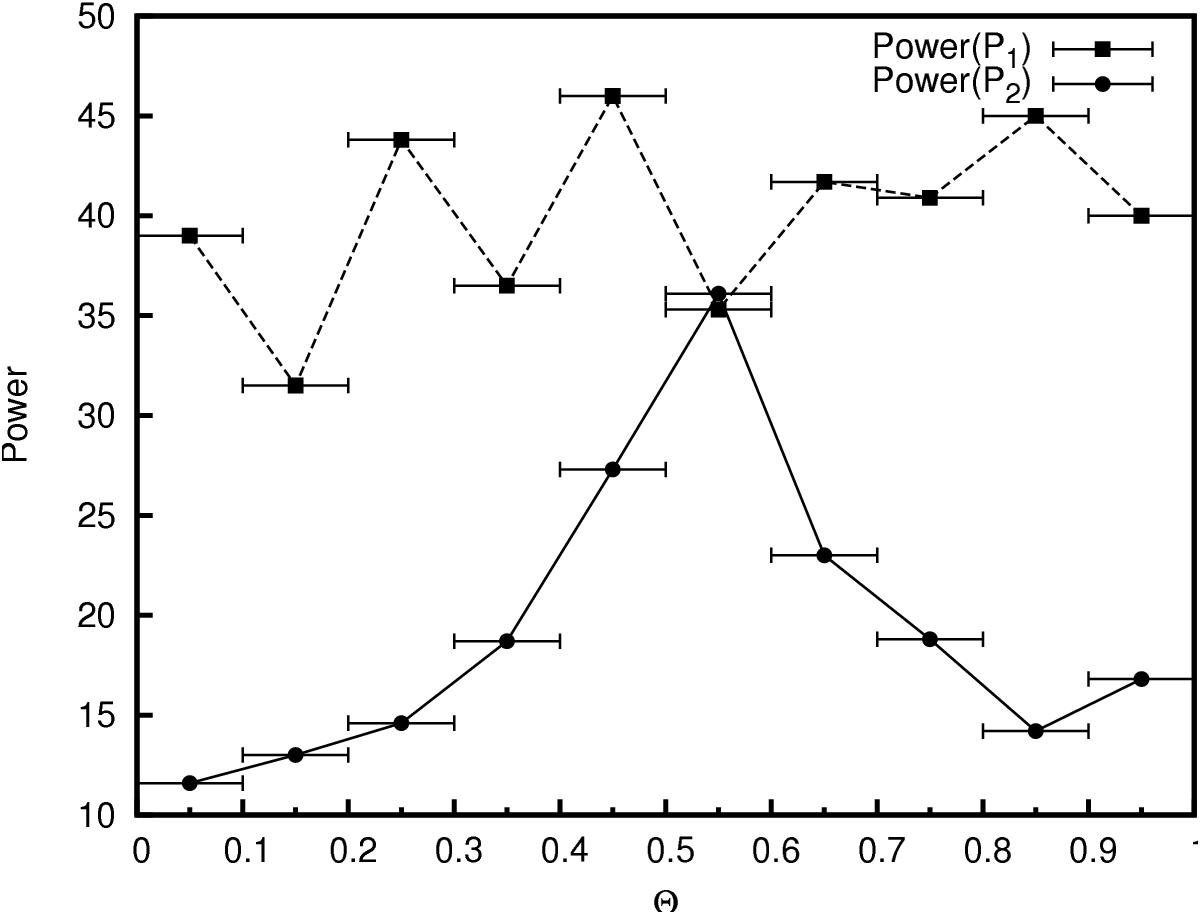
Test on the Θ interval that corrupts the timing analysis. In this plot the powers of P1 and P2 resulting from Lomb-Scargle timing analysis are plotted as a function of the Θ interval removed from the data, where interval is indicated with horizontal error bars. While the power of P1 is only affected very little and in a random way, the power of P2 shows a systematic trend peaking at Θ = 0.5−0.6.
Current usage metrics show cumulative count of Article Views (full-text article views including HTML views, PDF and ePub downloads, according to the available data) and Abstracts Views on Vision4Press platform.
Data correspond to usage on the plateform after 2015. The current usage metrics is available 48-96 hours after online publication and is updated daily on week days.
Initial download of the metrics may take a while.