Fig. 2
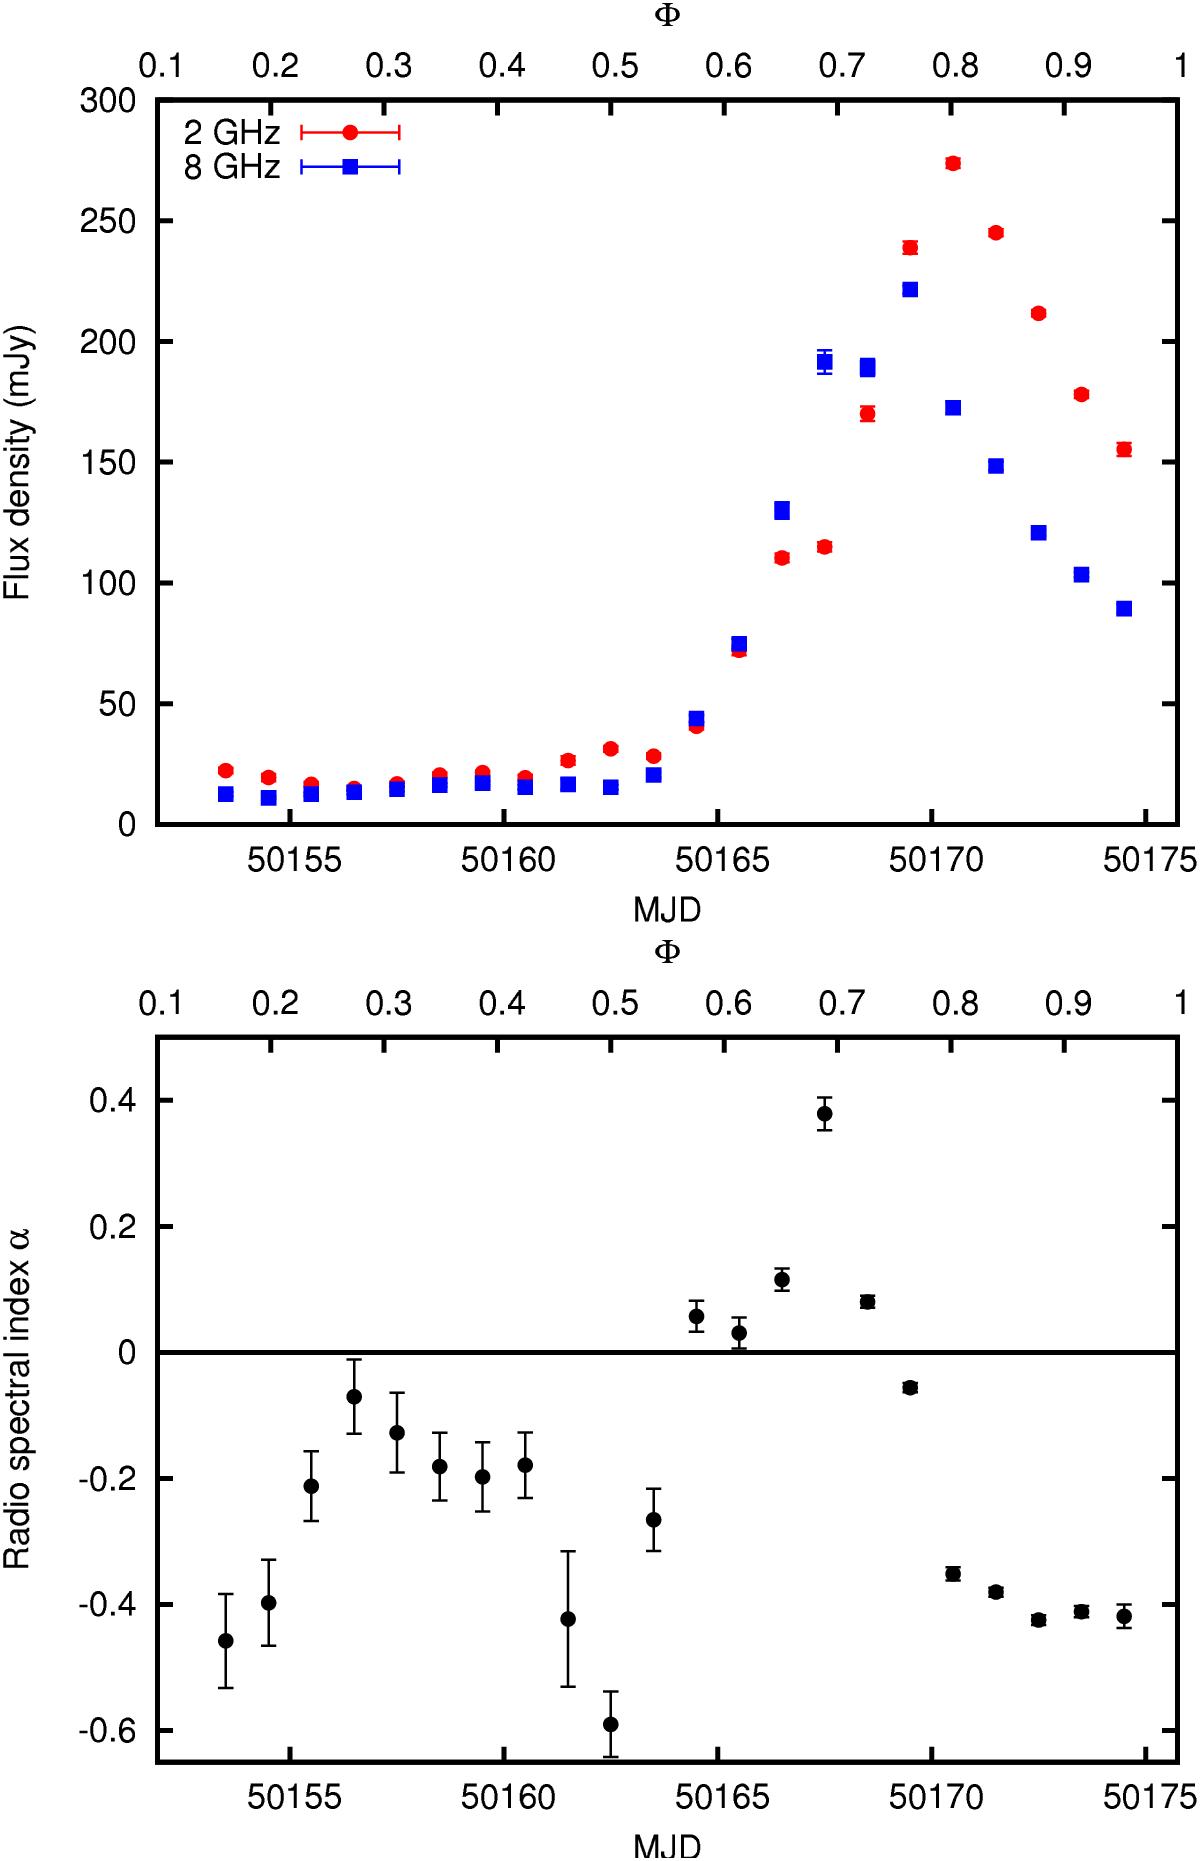
Top: radio light curve at 2 (red circles) and 8 GHz (blue squares) observed by the GBI from MJD 50 154.6 until 50 175.7 (orbital phase Φ = 0.1−1.0), averaged over one day. Bottom: radio spectral index α of the radio fluxes shown in the top panel clearly follows a two-peaked trend. One peak is during the large apastron radio outburst, which features a flat or inverted (α ≥ 0) spectrum during its rise. The other peak of the spectral index occurs at Φ = 0.25, i.e. at periastron, revealing that the spectrum becomes flattish (α ≈ 0) during this orbital phase as well (Massi & Kaufman Bernadó 2009).
Current usage metrics show cumulative count of Article Views (full-text article views including HTML views, PDF and ePub downloads, according to the available data) and Abstracts Views on Vision4Press platform.
Data correspond to usage on the plateform after 2015. The current usage metrics is available 48-96 hours after online publication and is updated daily on week days.
Initial download of the metrics may take a while.