Fig. 3
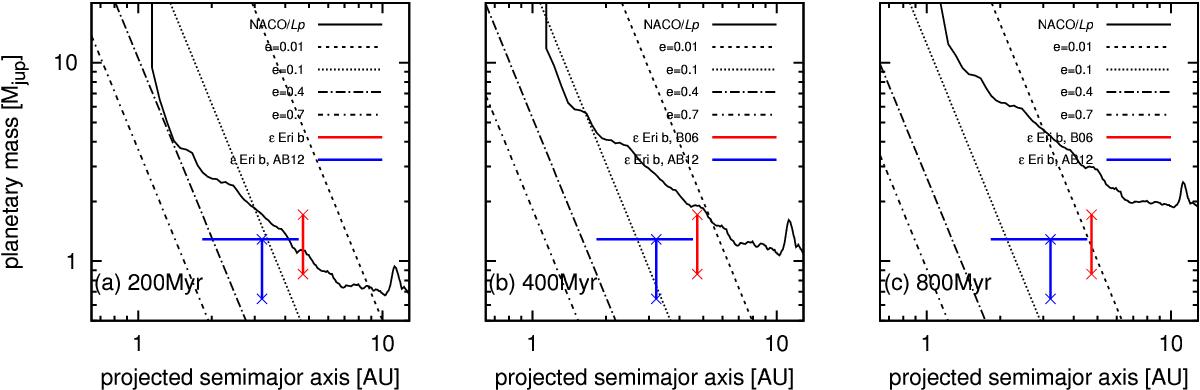
Detection sensitivity of ϵ Eri obtained by NACO/LP as a solid curve and ϵ Eri b are plotted as in Fig. 2, based on the AMES-Cond model with ages of 200, 400, and 800 Myr from left to right. The contours of the secular perturbation are shown for the asymmetric disk with different orbital eccentricities where tcross = tage is assumed. Dotted and dashed curves represent contours corresponding to the different orbital eccentricities of a planet around ϵ Eri: 0.01, 0.1, 0.4, and 0.7.
Current usage metrics show cumulative count of Article Views (full-text article views including HTML views, PDF and ePub downloads, according to the available data) and Abstracts Views on Vision4Press platform.
Data correspond to usage on the plateform after 2015. The current usage metrics is available 48-96 hours after online publication and is updated daily on week days.
Initial download of the metrics may take a while.