Fig. 2
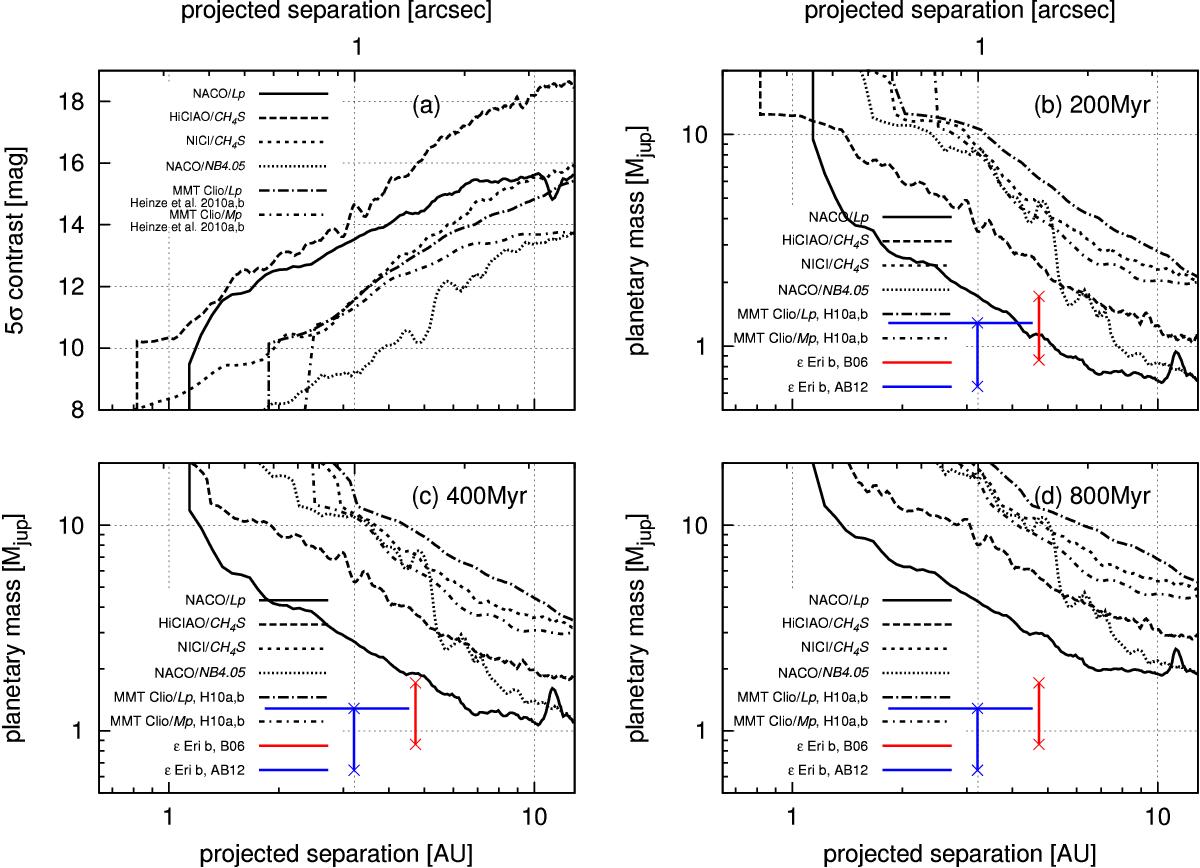
Detection sensitivities of ϵ Eri. Panel a) shows 5σ contrast curves estimated on reduced images. For comparison, detection sensitivities with the Clio camera on the Multiple Mirror Telescope are also shown (Heinze et al. 2010a,b). Panels b), c), and d) represent 5σ detection sensitivity in terms of planetary mass based on the AMES-Cond model of 200, 400, and 800 Myr, respectively (Allard et al. 2001; Baraffe et al. 2003). The red (right) and blue (left) points in these panels show the previously reported planet, ϵ Eri b, whose projected separations are considered to be the location on 21–27 November 2012 and its possible range with known parameters (Benedict et al. 2006; Anglada-Escudé & Butler 2012), respectively. The upper and lower limit of these points correspond to the mass of ϵ Eri b with sini = 0.5 and 1.0, respectively.
Current usage metrics show cumulative count of Article Views (full-text article views including HTML views, PDF and ePub downloads, according to the available data) and Abstracts Views on Vision4Press platform.
Data correspond to usage on the plateform after 2015. The current usage metrics is available 48-96 hours after online publication and is updated daily on week days.
Initial download of the metrics may take a while.