Fig. 7
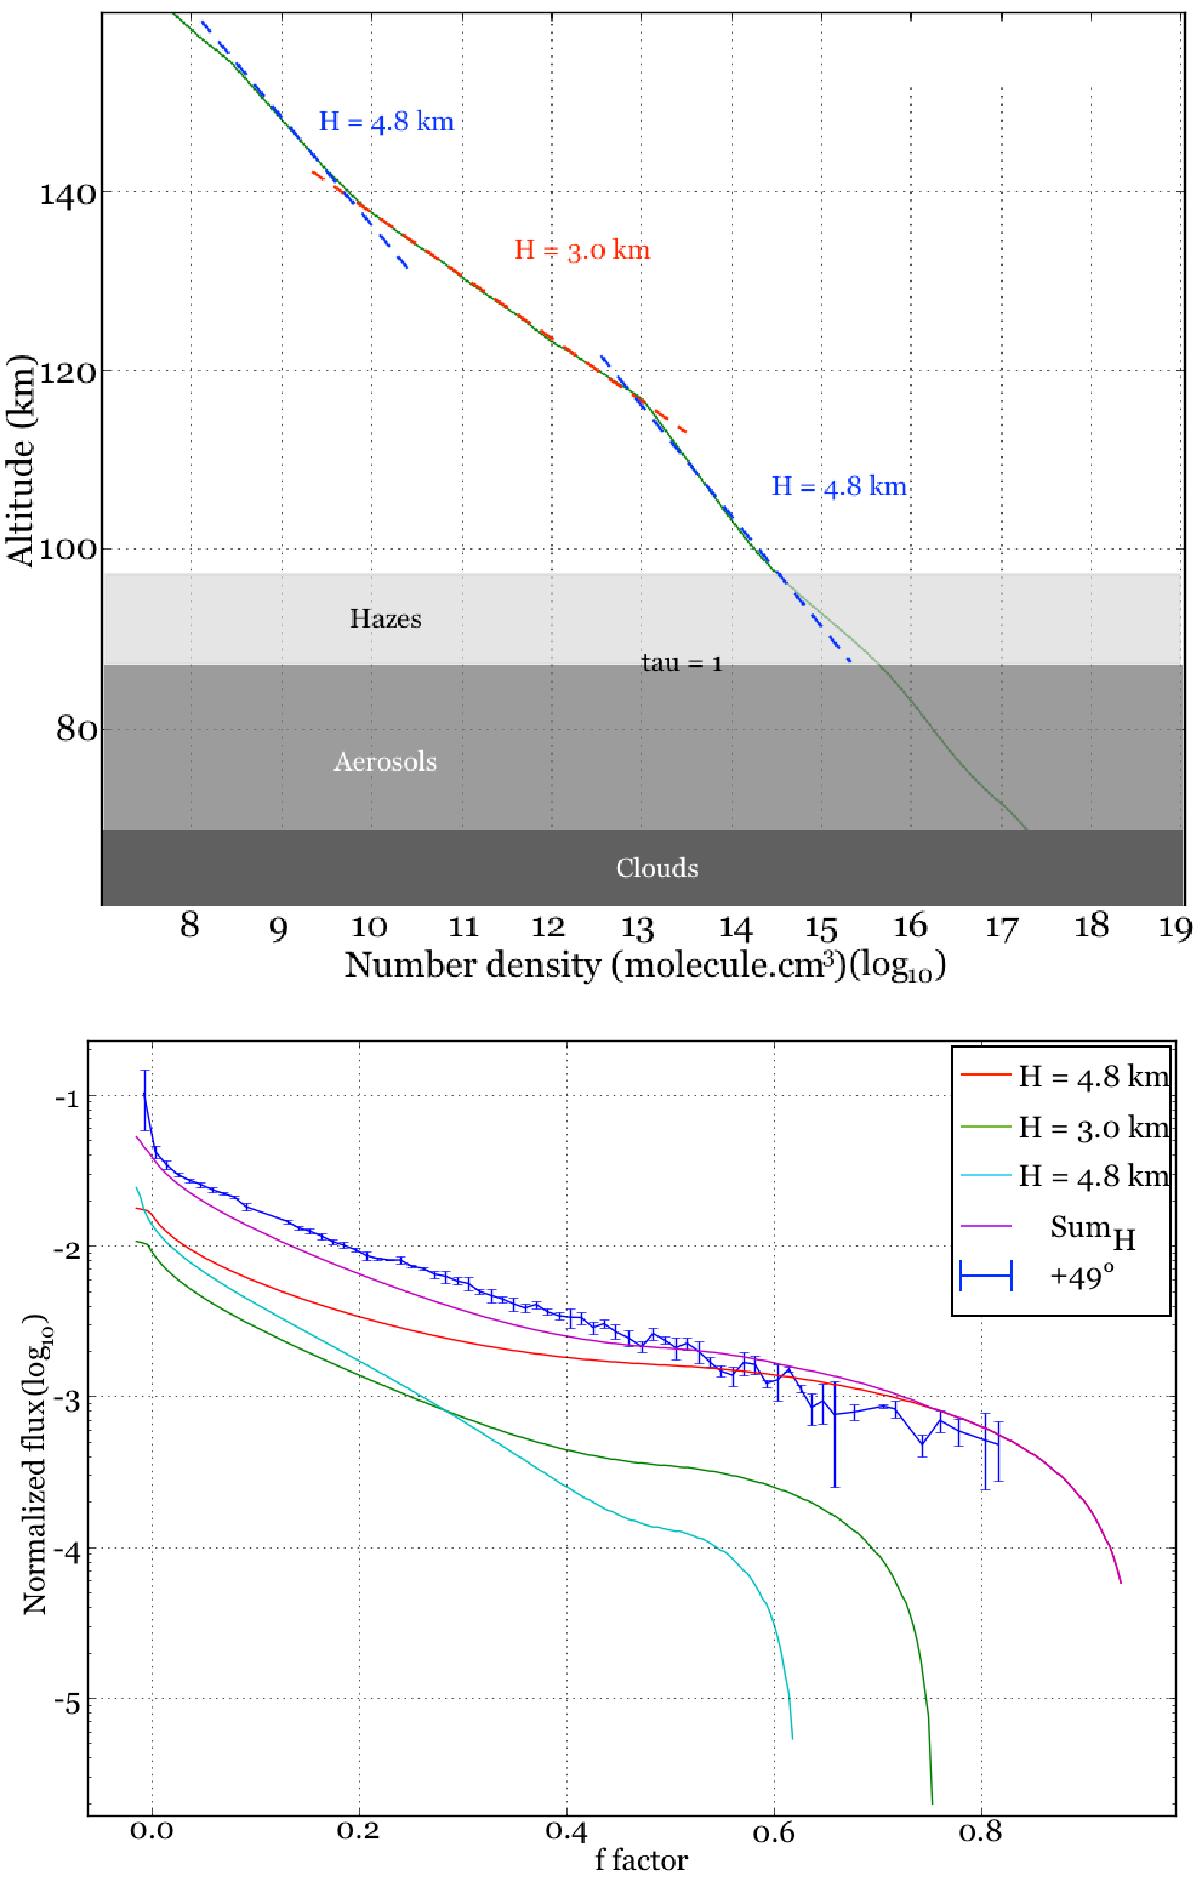
Top: molecular density measured by SOIR. We consider three main layers above the cloud top (rcloud ~ 94 km). The slope of a linear fit over three segments provides three scale heights, H1 = 4.8 km for altitudes below 116 km, H2 = 3.0 km (116 to 135 km), and H3 = 4.8 km (135 to 160 km). Bottom: results of the three-layer modeling (best fit). See Table 3 for the model parameters. The purple (upper) curve represents the summation of the fluxes from each of the three layers, here represented in cyan, green, and red. The blue data points are the measurements, as reported in Fig. 6.
Current usage metrics show cumulative count of Article Views (full-text article views including HTML views, PDF and ePub downloads, according to the available data) and Abstracts Views on Vision4Press platform.
Data correspond to usage on the plateform after 2015. The current usage metrics is available 48-96 hours after online publication and is updated daily on week days.
Initial download of the metrics may take a while.