Fig. 3
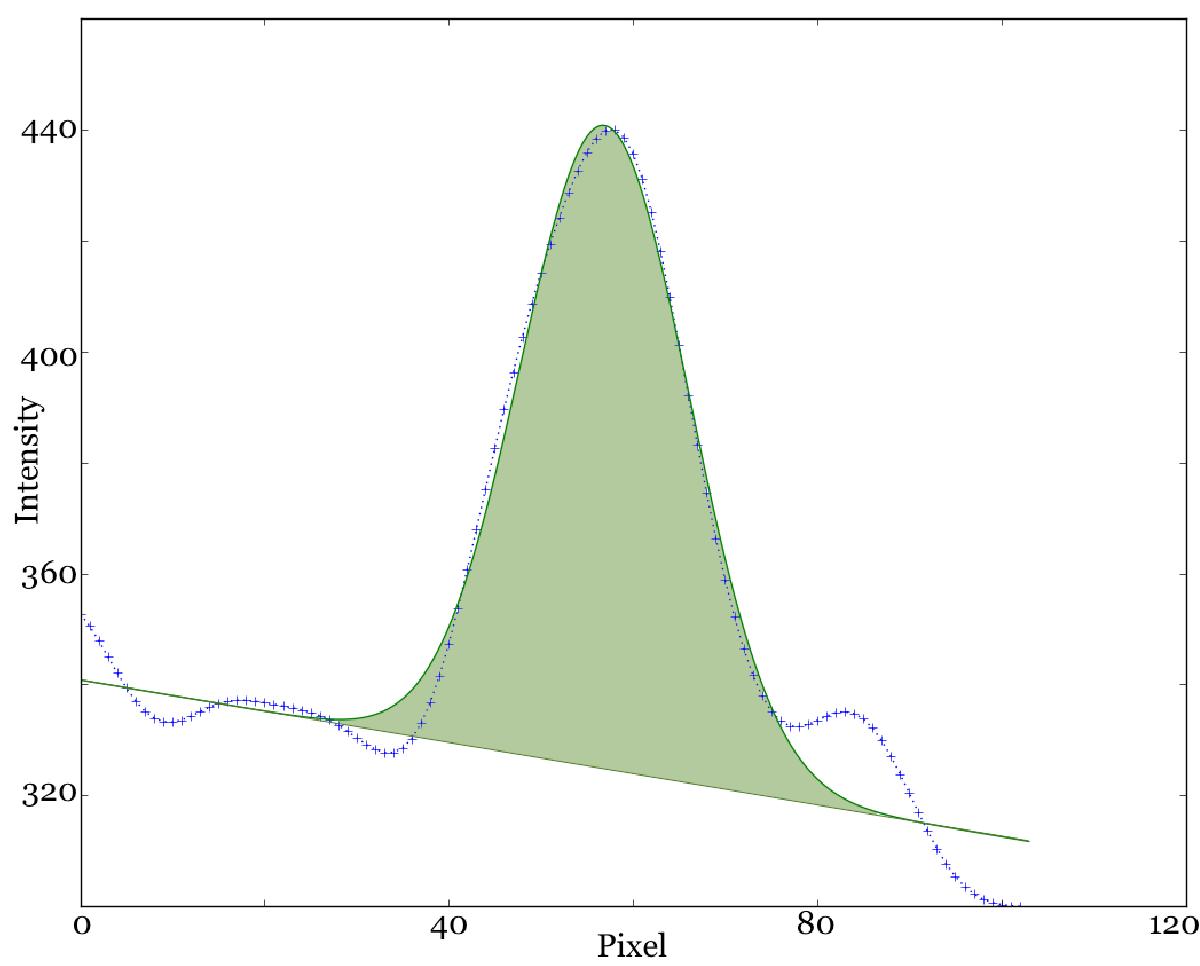
Radial intensity profile of the aureole (blue crosses) as a function of the number of HMI pixels along the radial direction from the center of Venus. The profile has been measured from one SDO/HMI frame, collected on June 5th, 2012 at 22:21:55, for the latitude +49°. The blue dots represent the bilinear interpolation performed on the radial profile at steps of 1/10 of one pixel. The vertical axis is the signal intensity in ADU. The green curve is the result of a Gaussian fit with a linear slope. The width at half-height is 1.875 arcsec and corresponds to 390 km at Venus.
Current usage metrics show cumulative count of Article Views (full-text article views including HTML views, PDF and ePub downloads, according to the available data) and Abstracts Views on Vision4Press platform.
Data correspond to usage on the plateform after 2015. The current usage metrics is available 48-96 hours after online publication and is updated daily on week days.
Initial download of the metrics may take a while.