Fig. 5
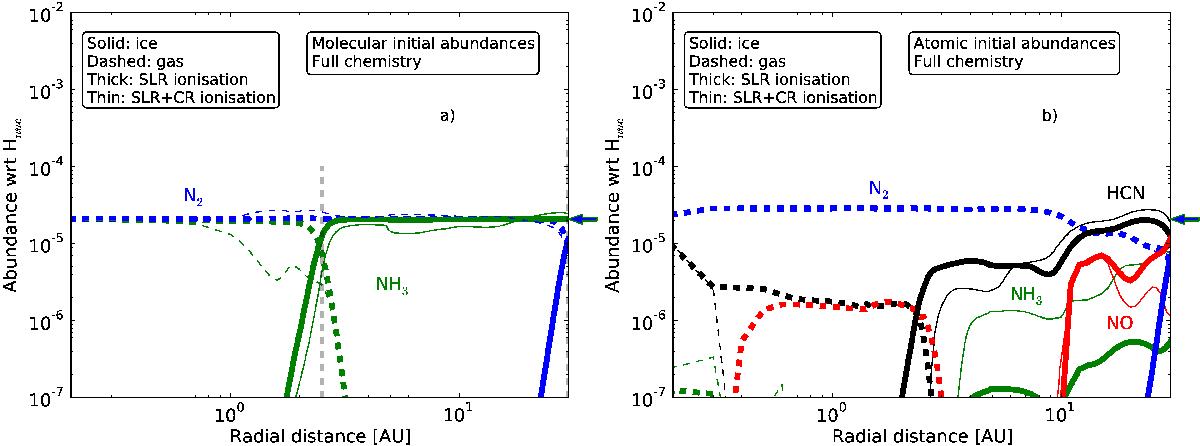
Final abundances for the major nitrogen species obtained with the full chemical network. Solid curves show ice abundances, dashed curves show gas abundances. Thin curves are for low ionisation level, and thick curves are for high ionisation level. The physical conditions and initial abundances in Fig. 5a are identical to those considered in Figs. 3a and c. Likewise, for Fig. 5b the assumptions are identical to those in Figs. 3b and d. The arrow on the right-hand side of each plot indicate the initial abundances of N2 and NH3. They have the same initial abundances and hence share arrow. The grey, dashed, vertical line in panel a) indicates the iceline position of NH3. The position of the iceline is the same in panel b). The iceline of N2 is at 30 AU, and therefore not seen.
Current usage metrics show cumulative count of Article Views (full-text article views including HTML views, PDF and ePub downloads, according to the available data) and Abstracts Views on Vision4Press platform.
Data correspond to usage on the plateform after 2015. The current usage metrics is available 48-96 hours after online publication and is updated daily on week days.
Initial download of the metrics may take a while.