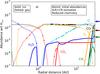
Fig. 2
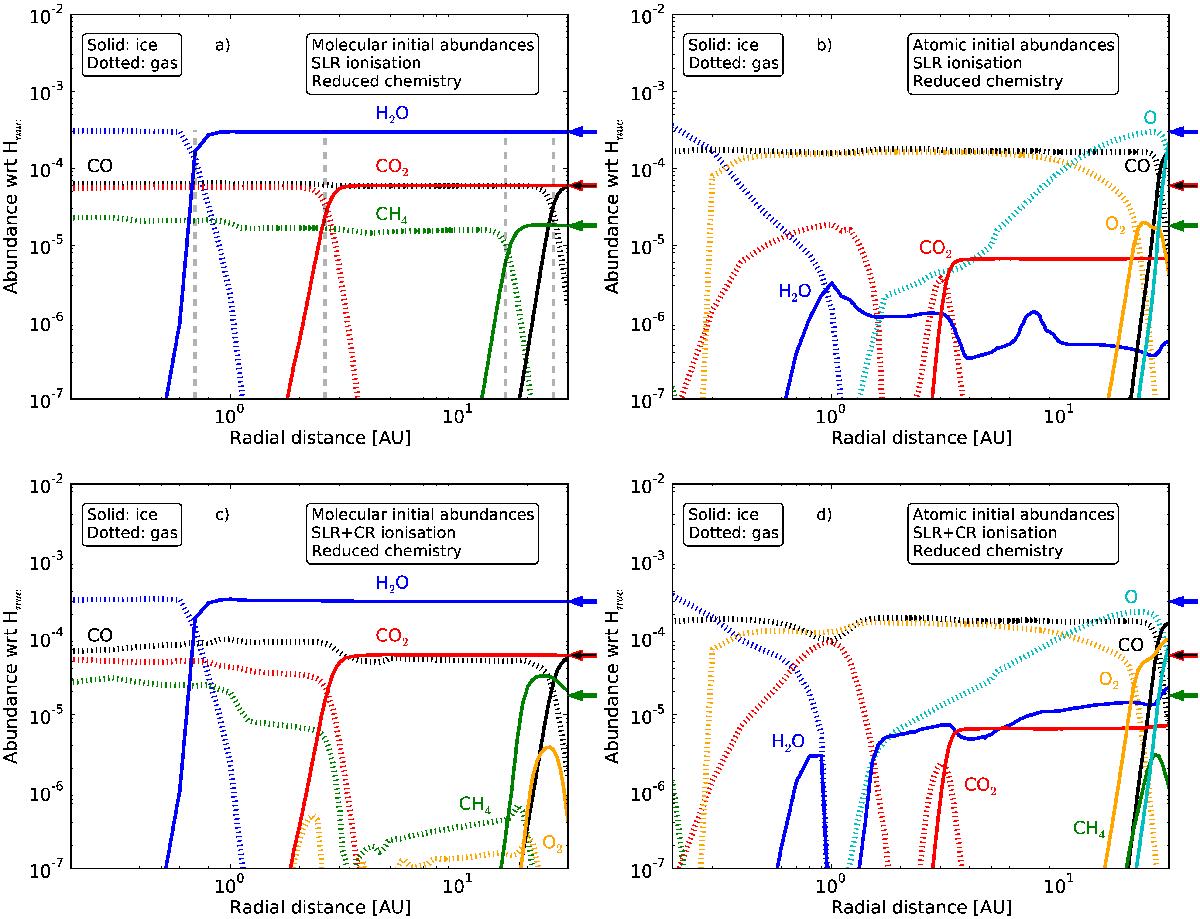
Final abundances with respect to total H nuclei density as function of radial distance R from the star for key volatile species, when using the reduced chemical network (see Table 2). In all panels, the solid lines show the ice abundances and the dotted curves show the gas abundances. The top two panels show the results for the low ionisation case (SLRs only) and the bottom two panels show those for the high ionisation case (SLRs and CRs). The left-hand panels show the results when assuming the “inheritance” scenario and the right-hand panels show those when assuming the “reset” scenario (see Table 1). (see Table 1). The arrows on the right-hand side of each plot indicate the initial abundances of H2O, CO2, CO, and CH4 gases in the inheritance scenario. CO and CO2 share the same arrow (red with black filling), because they have the same initial abundances. The grey, dashed, vertical lines in panel a) indicate the iceline positions of H2O, CO2, CH4 and CO, respectively, from the inner to the outer disk. The positions of these icelines are the same in the other panels.
Current usage metrics show cumulative count of Article Views (full-text article views including HTML views, PDF and ePub downloads, according to the available data) and Abstracts Views on Vision4Press platform.
Data correspond to usage on the plateform after 2015. The current usage metrics is available 48-96 hours after online publication and is updated daily on week days.
Initial download of the metrics may take a while.