Fig. 1
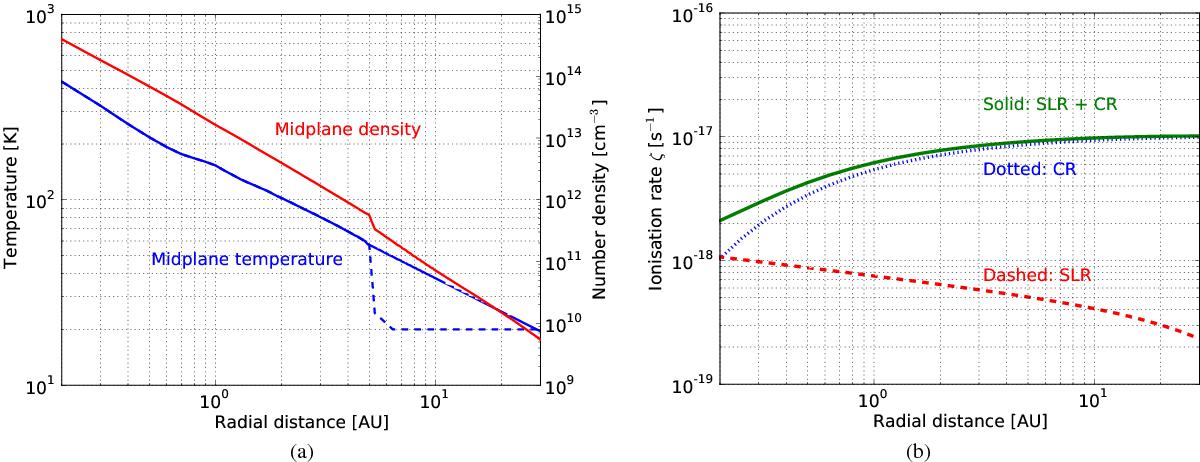
a) Temperature T(R) in K (blue) and number density n(R) in cm-3 (red) profiles for the disk midplane. The solid blue line indicates the adjusted temperature profile (as described in the text). The original temperature profile from Alibert et al. (2013) beyond 5.2 AU is indicated by the dashed blue line. b) Ionisation rate ζ(R) in s-1 adopted for the disk midplane. The red dashed line depicts the contribution to the ionisation rate from short-lived radionuclides (SLRs) only. The blue dotted line is the contribution from external cosmic rays (CRs) only. The solid green line represents the total ionisation rate (SLRs and CRs) as a function of radial distance.
Current usage metrics show cumulative count of Article Views (full-text article views including HTML views, PDF and ePub downloads, according to the available data) and Abstracts Views on Vision4Press platform.
Data correspond to usage on the plateform after 2015. The current usage metrics is available 48-96 hours after online publication and is updated daily on week days.
Initial download of the metrics may take a while.