Fig. 6
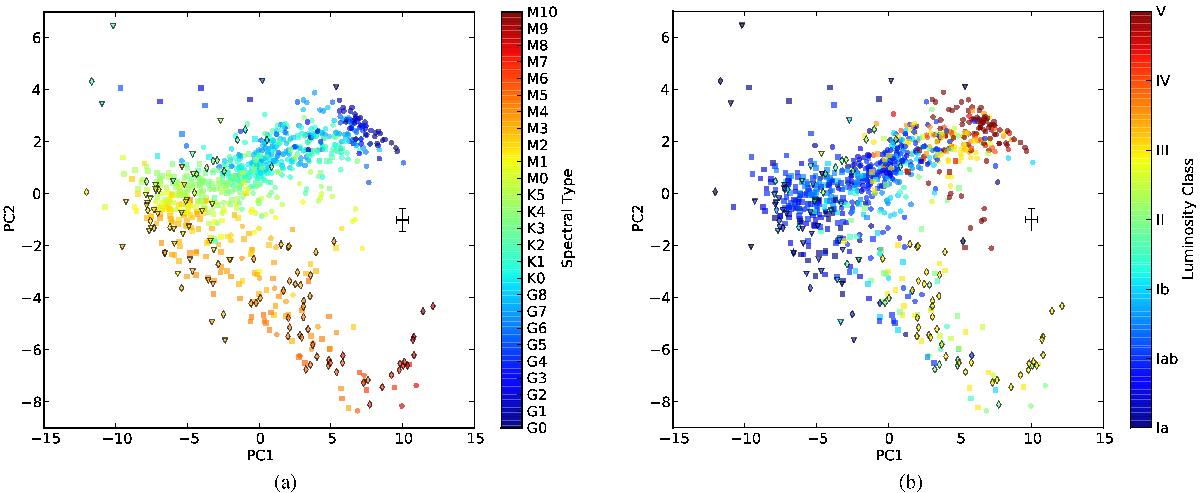
Left (panel a)): PC1 versus PC2 diagram. The colour indicates the SpT. The symbols used are the same as in Fig. 4. The cross indicates the median uncertainties, which have been calculated by propagating the uncertainties through the lineal combination of the input data (EWs and bandheads) with the coefficients calculated. Right (panel b)): the same as left figure, but here the colour indicates the luminosity class.
Current usage metrics show cumulative count of Article Views (full-text article views including HTML views, PDF and ePub downloads, according to the available data) and Abstracts Views on Vision4Press platform.
Data correspond to usage on the plateform after 2015. The current usage metrics is available 48-96 hours after online publication and is updated daily on week days.
Initial download of the metrics may take a while.