Fig. A.3
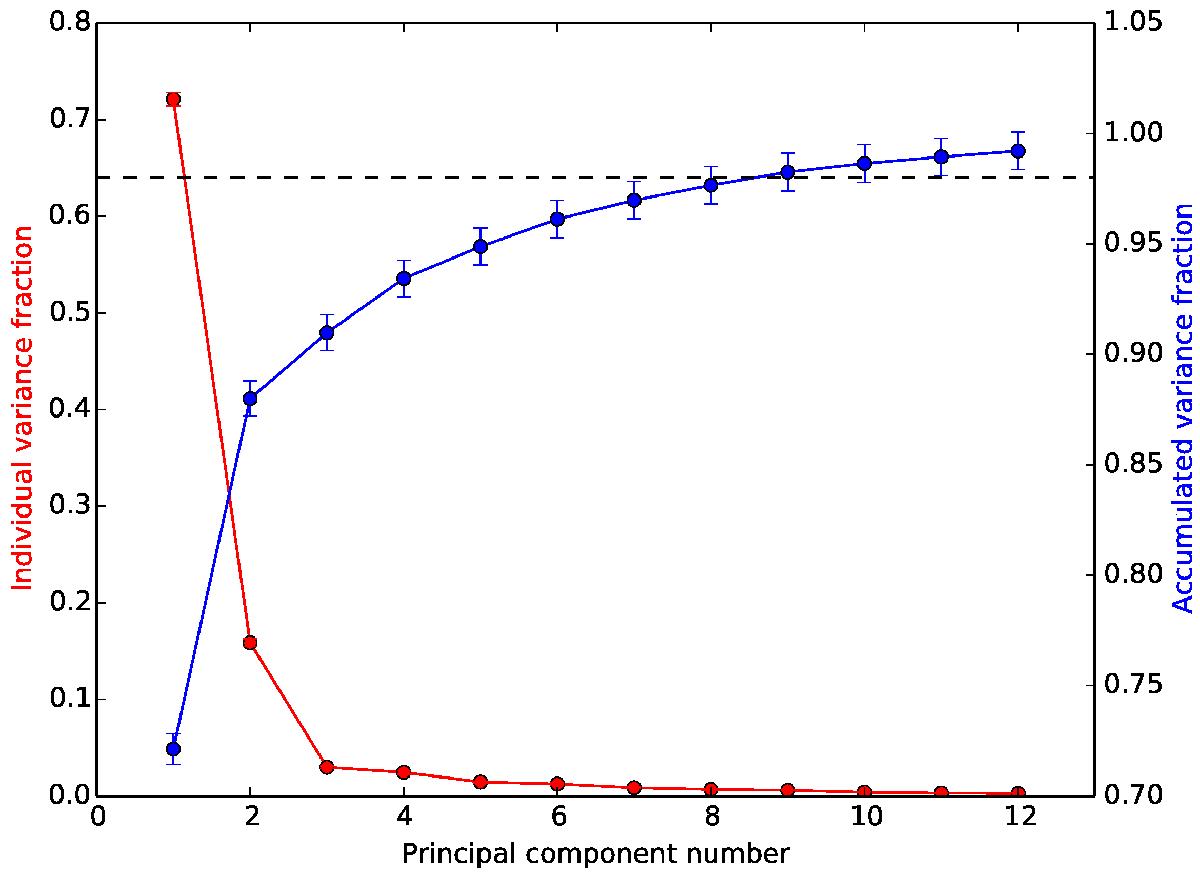
Summary of variance fractions of the principal components calculated from the Gaia input list. The red circles are the individual variance (left vertical axis). The blue circles are the accumulated variance (right vertical axis). As the PCA calculations were done for 10 000 random samples, each circle is the median of the 10 000 variances obtained for each PC. The error bar in each point is its correspondent standard deviation. The circles without error bars have errors smaller than the circle itself. Only the first 12 PCs are displayed here. The horizontal discontinued line marks the 98% of the accumulated variance.
Current usage metrics show cumulative count of Article Views (full-text article views including HTML views, PDF and ePub downloads, according to the available data) and Abstracts Views on Vision4Press platform.
Data correspond to usage on the plateform after 2015. The current usage metrics is available 48-96 hours after online publication and is updated daily on week days.
Initial download of the metrics may take a while.