Fig. 14
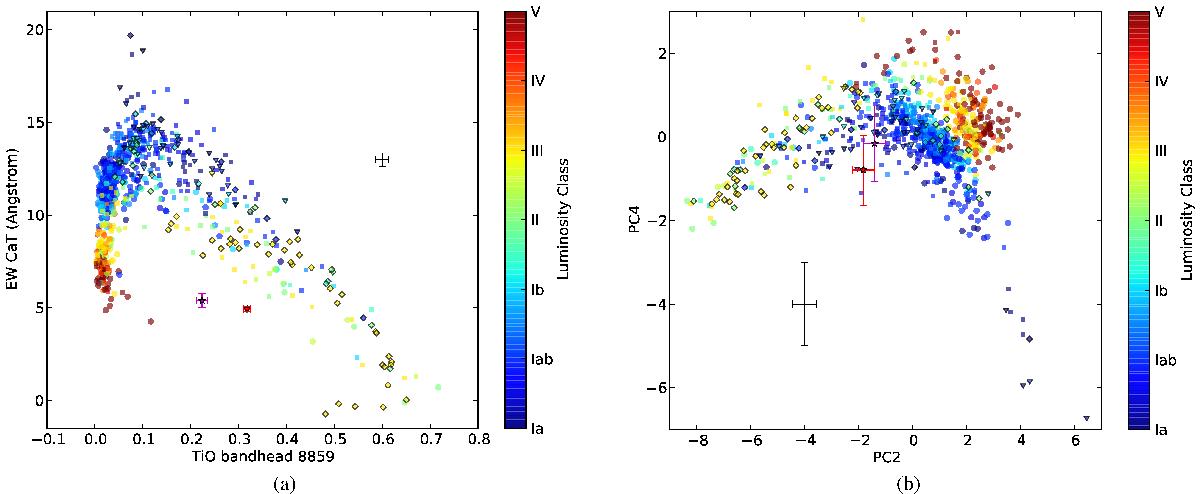
Left (panel a)): depth of the TiO bandhead at 8859Å with respect to the sum of the EWs of the CaT lines. The shapes are the same as in Fig. 4. The black cross indicates the median uncertainties. The magenta star is the ERSG S Per, and the red star is UY Sct, both with their own error bars. Right (panel b)): PC2 versus PC4 diagram. The symbols are the same as in the left figure. The black cross indicates the median uncertainties, which have been calculated by propagating the uncertainties through the lineal combination of the input data (EWs and bandheads) with the coefficients calculated. The magenta and red stars are the same as in the left panel.
Current usage metrics show cumulative count of Article Views (full-text article views including HTML views, PDF and ePub downloads, according to the available data) and Abstracts Views on Vision4Press platform.
Data correspond to usage on the plateform after 2015. The current usage metrics is available 48-96 hours after online publication and is updated daily on week days.
Initial download of the metrics may take a while.