Fig. 12
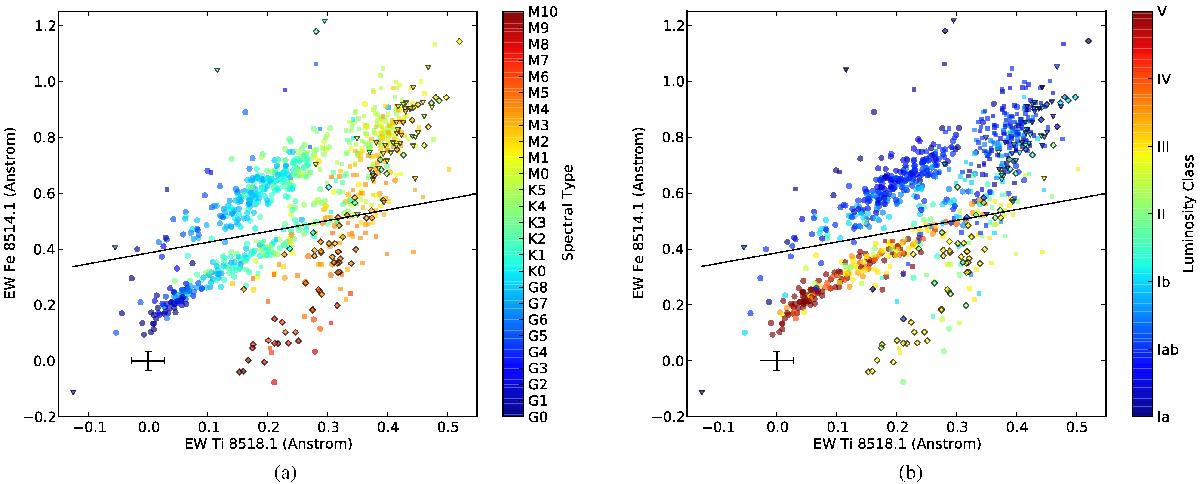
Left (panel a)): EWs of the lines Fe i8514Å and Ti i8518Å. The colour indicates the SpT. The shapes are the same as in Fig. 4. The cross indicates the median uncertainties. The black line is the calculated separation between SGs and non-SGs (see text). Right (panel b)): the same as in left figure, but the colour indicates the luminosity class.
Current usage metrics show cumulative count of Article Views (full-text article views including HTML views, PDF and ePub downloads, according to the available data) and Abstracts Views on Vision4Press platform.
Data correspond to usage on the plateform after 2015. The current usage metrics is available 48-96 hours after online publication and is updated daily on week days.
Initial download of the metrics may take a while.