Fig. 5
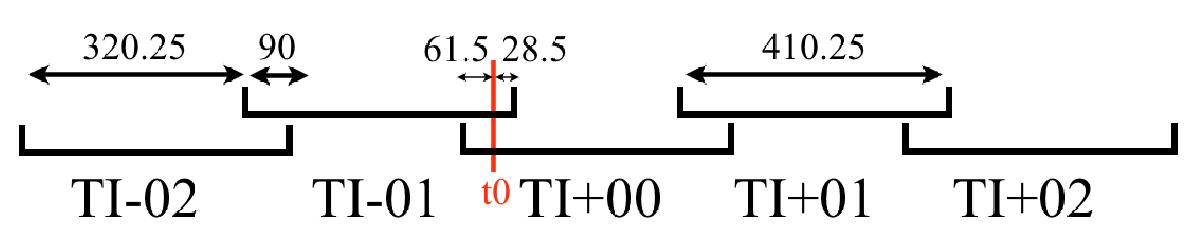
Sketch of the distribution of datacubes in time. The rectangular sections indicate the extent of single datacubes, labelled by the time interval number “TI”. The numbers across the top are in minutes. Intervals start every 320 min, are 410.25 min long, and overlap by 90 min. We show only the datacubes close to the emergence time, t0, indicated in red. In general, the EAR and CR extend both further forwards and backwards in time.
Current usage metrics show cumulative count of Article Views (full-text article views including HTML views, PDF and ePub downloads, according to the available data) and Abstracts Views on Vision4Press platform.
Data correspond to usage on the plateform after 2015. The current usage metrics is available 48-96 hours after online publication and is updated daily on week days.
Initial download of the metrics may take a while.