Fig. 1
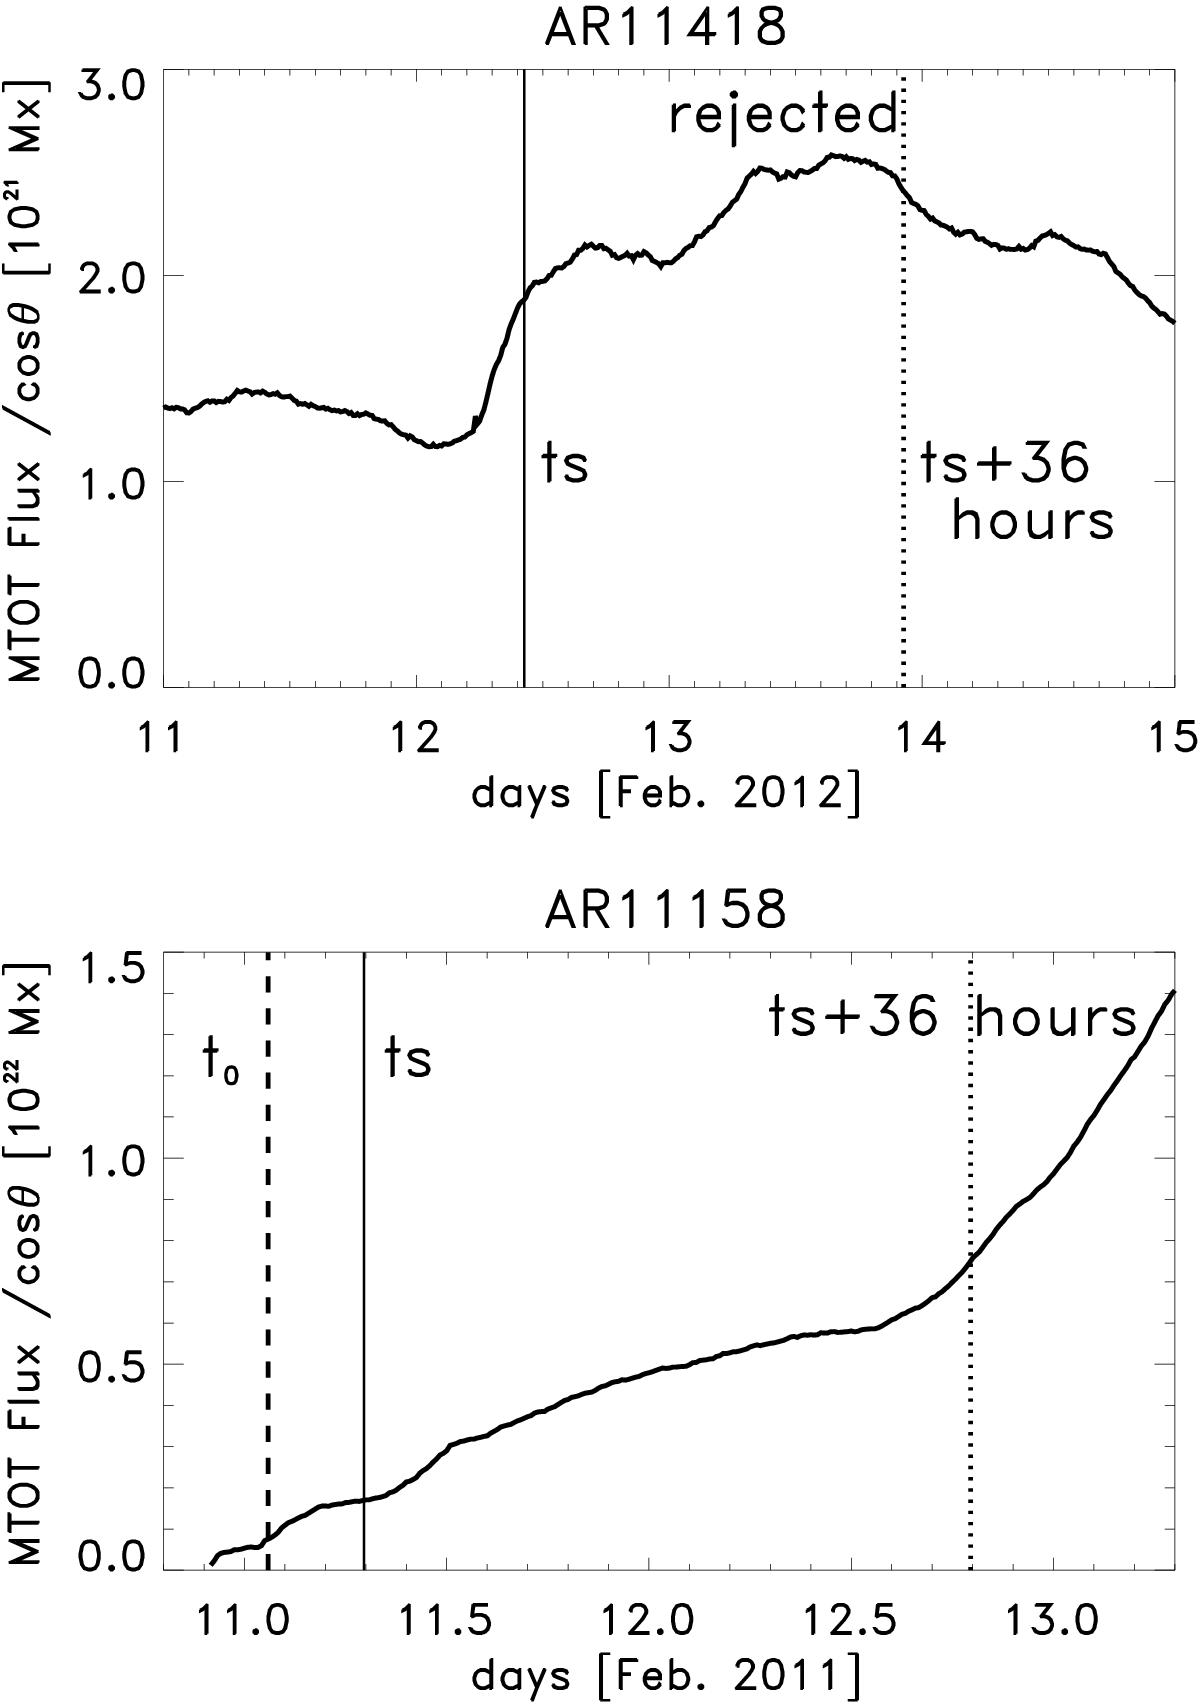
Corrected MTOT flux as a function of time for two example emerging active region candidates. The solid line represents the time, ts, when NOAA first recorded a numbered sunspot region. The top panel shows an example of an emerging sunspot group, AR 11418, which we rejected from our survey. While an increase of new flux is apparent near the time ts, it is obvious that considerable flux already exists within the SHARP boundary. The bottom panel shows an example, AR 11158, which we included in the survey. The thick dashed line indicates the emergence time t0 when the flux was 10% of its peak value within the interval bounded by the solid and dotted lines, ts and ts + 36 h, respectively.
Current usage metrics show cumulative count of Article Views (full-text article views including HTML views, PDF and ePub downloads, according to the available data) and Abstracts Views on Vision4Press platform.
Data correspond to usage on the plateform after 2015. The current usage metrics is available 48-96 hours after online publication and is updated daily on week days.
Initial download of the metrics may take a while.