Free Access
Fig. 13
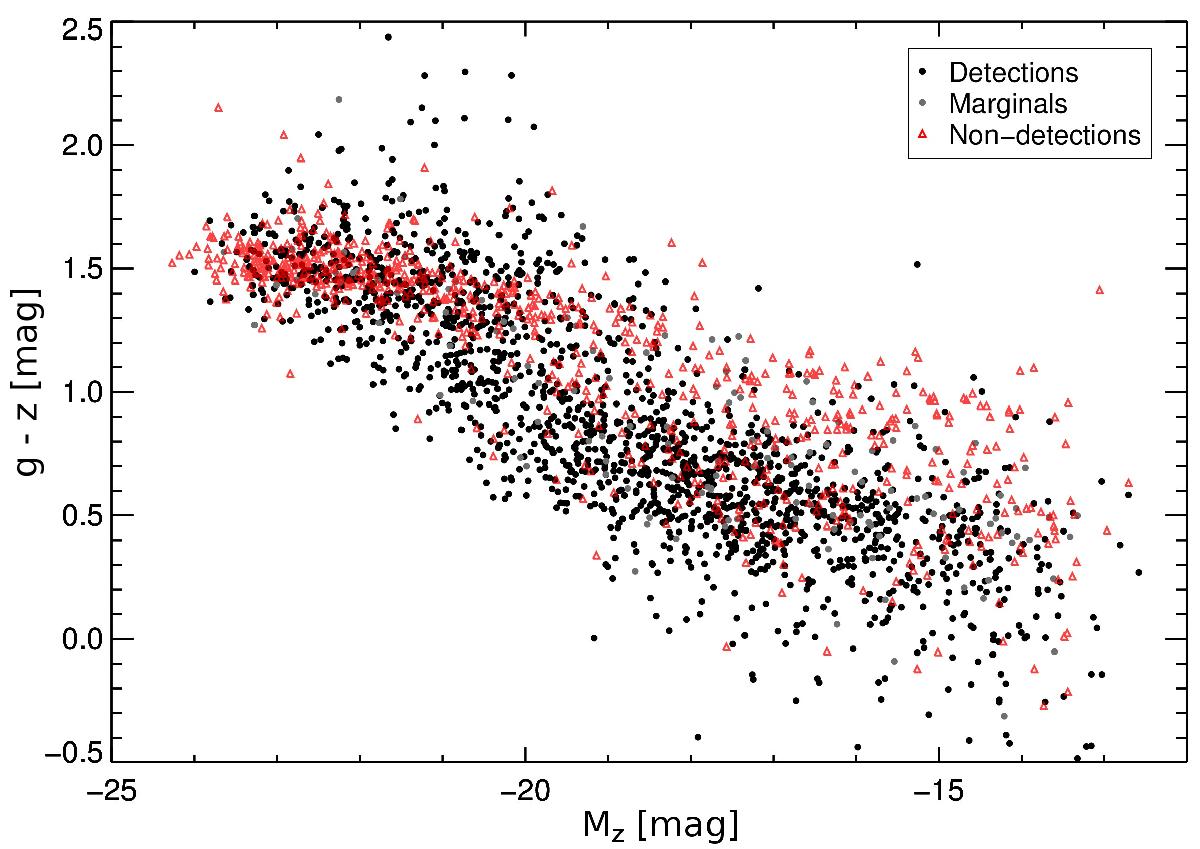
Integrated g–z color, in mag, as a function of absolute z-band magnitude, Mz. All data were corrected for Galactic extinction following Schlegel et al. (1998). Black dots represent clear NIBLES detections, gray dots marginal detections, and red triangles estimated non-detections.
Current usage metrics show cumulative count of Article Views (full-text article views including HTML views, PDF and ePub downloads, according to the available data) and Abstracts Views on Vision4Press platform.
Data correspond to usage on the plateform after 2015. The current usage metrics is available 48-96 hours after online publication and is updated daily on week days.
Initial download of the metrics may take a while.