Fig. 2
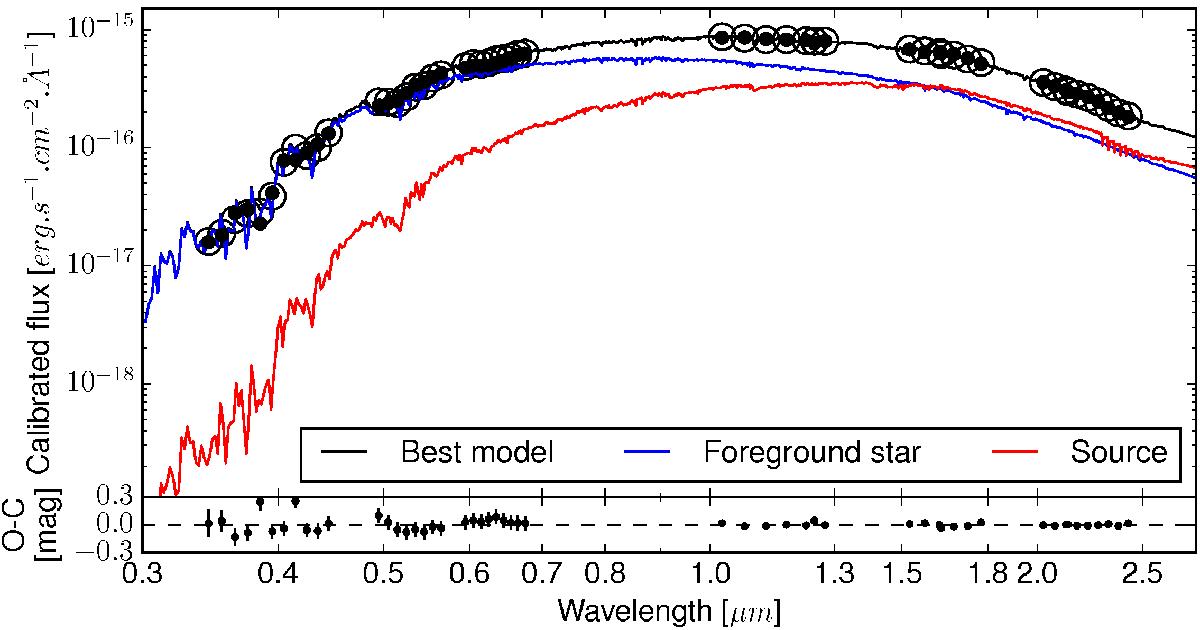
Spectral energy distribution of OGLE-417 together with the best-fit model. The black dots are the measured SED while the open circles are the integrated model in the corresponding bandpasses. The black line is the best model that fit the spectroscopic data and the red and blue lines are the individual model of the source and foreground star (respectively). The bottom panel shows the residuals to the best fit.
Current usage metrics show cumulative count of Article Views (full-text article views including HTML views, PDF and ePub downloads, according to the available data) and Abstracts Views on Vision4Press platform.
Data correspond to usage on the plateform after 2015. The current usage metrics is available 48-96 hours after online publication and is updated daily on week days.
Initial download of the metrics may take a while.