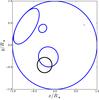
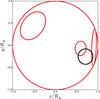
Fig. 6
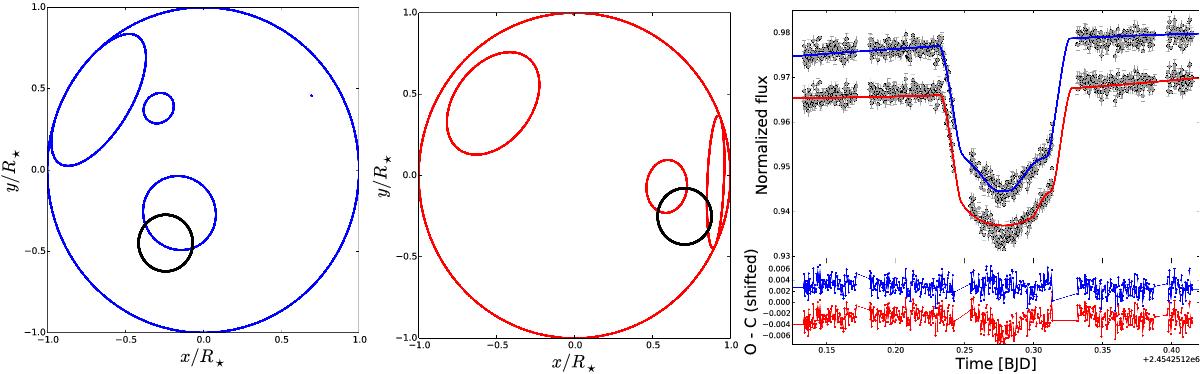
Left: planet (black) and activity features (blue) configuration during the deepest transit, with bright spots allowed. The bright spots are crossed by the planetary disc. Centre: solution with three dark spots (red). Right: deepest transit fitted with the dark-bright spot configuration (blue) and the three-dark spots model (red, shifted). The residuals are shifted for clarity and use the same colour code.
Current usage metrics show cumulative count of Article Views (full-text article views including HTML views, PDF and ePub downloads, according to the available data) and Abstracts Views on Vision4Press platform.
Data correspond to usage on the plateform after 2015. The current usage metrics is available 48-96 hours after online publication and is updated daily on week days.
Initial download of the metrics may take a while.