Fig. 3
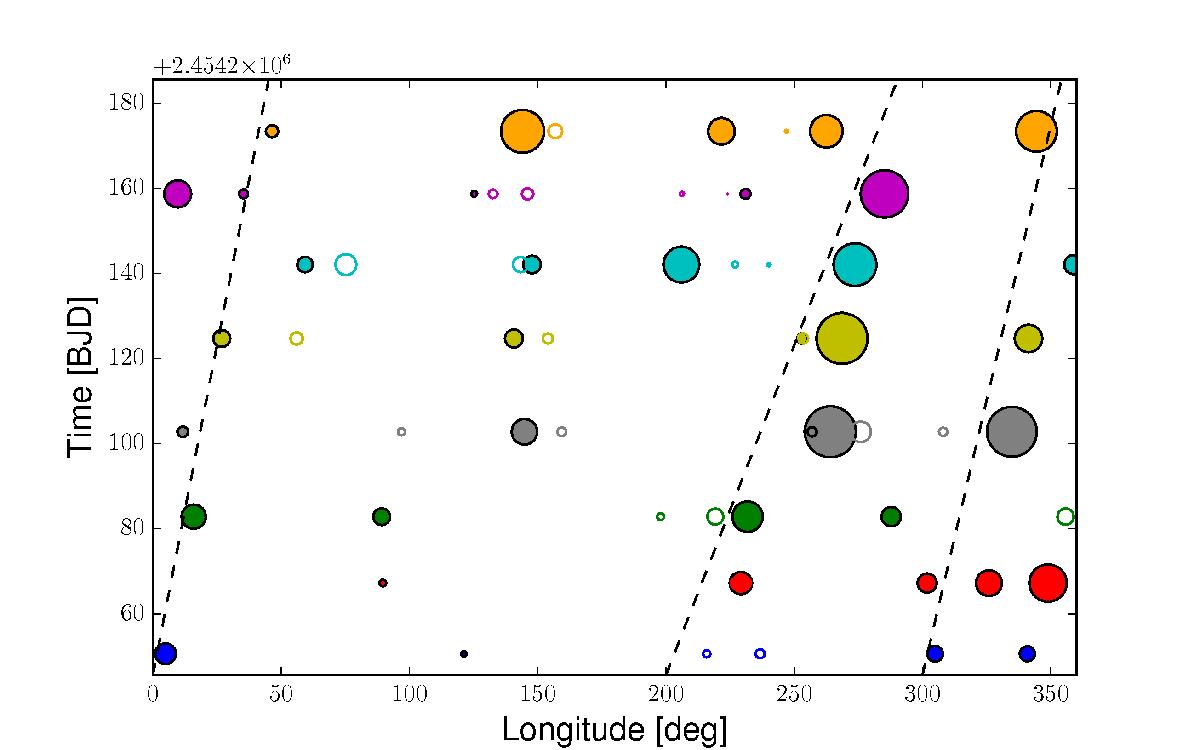
Distribution of the activity features as a function of their longitude and time. No latitudinal information is reported. Filled circles represent dark spots, empty circles represent bright ones. Different segments of the light curve are represented by circles of different colour. The relative size of the features compared to the stellar surface was increased for the sake of illustration. Tentative reconstruction of longitudinal migration are represented by diagonal dashed lines.
Current usage metrics show cumulative count of Article Views (full-text article views including HTML views, PDF and ePub downloads, according to the available data) and Abstracts Views on Vision4Press platform.
Data correspond to usage on the plateform after 2015. The current usage metrics is available 48-96 hours after online publication and is updated daily on week days.
Initial download of the metrics may take a while.