Fig. 1
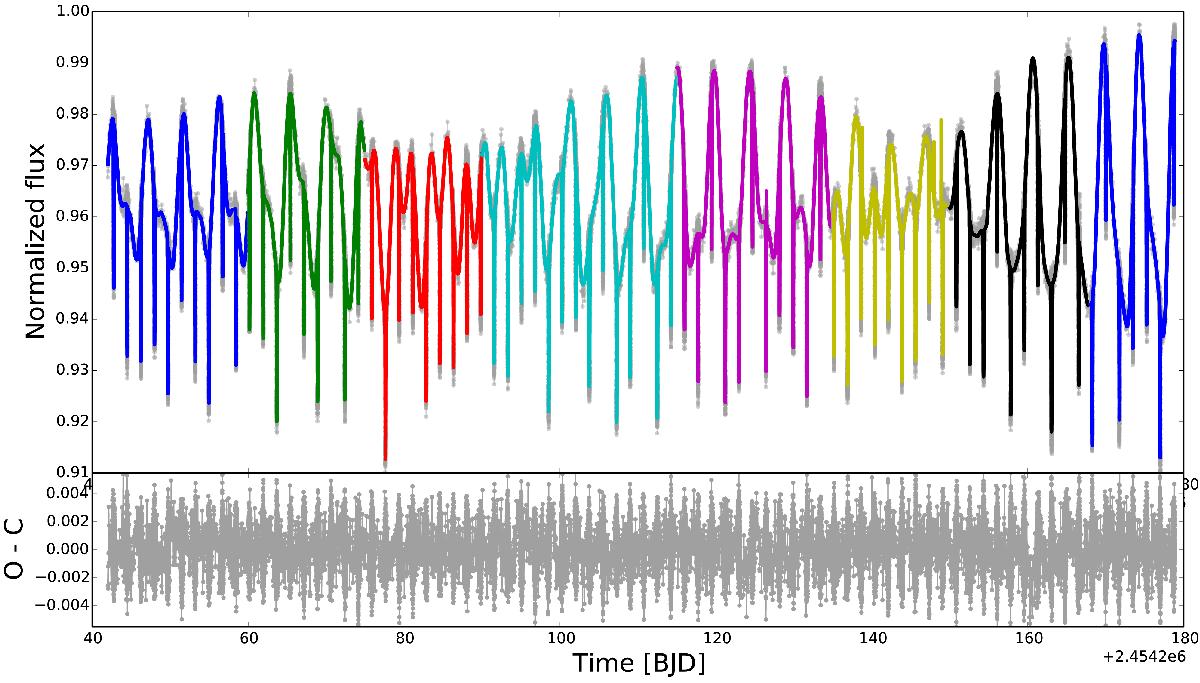
Model light curve from KSint plotted over the data. The eight segments of the fit are divided by colour. The residuals are shown in the lower panels; the error bars are not shown for clarity. The larger amplitude of the residuals in correspondence with the transits is due to the full resolution kept for the transits. The out-of-transit binning is of 2016 s, and inside the transits 32 s.
Current usage metrics show cumulative count of Article Views (full-text article views including HTML views, PDF and ePub downloads, according to the available data) and Abstracts Views on Vision4Press platform.
Data correspond to usage on the plateform after 2015. The current usage metrics is available 48-96 hours after online publication and is updated daily on week days.
Initial download of the metrics may take a while.