Fig. 4
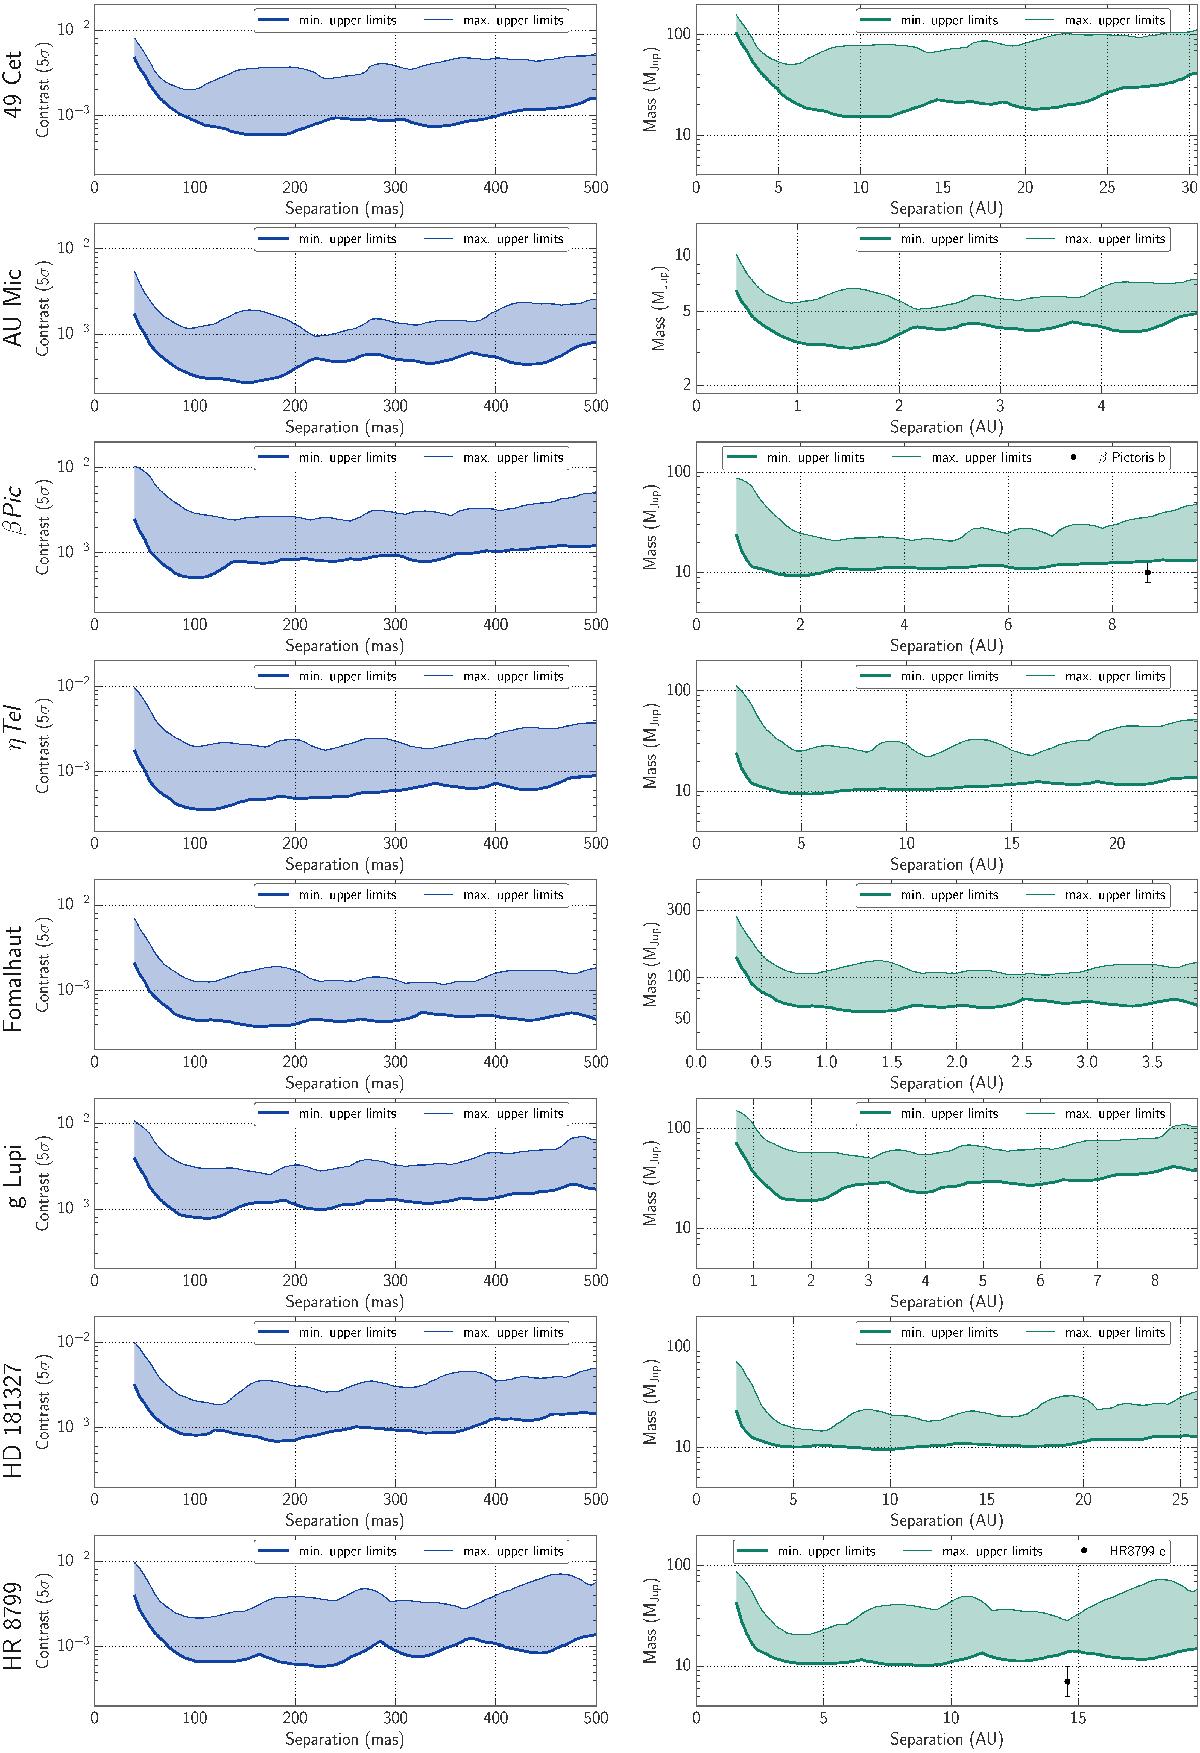
Radial distribution of the detection limits. On the left, blue graphs display contrast as a function of the angular distance in milliarcseconds, this expresses the performance of the detection. On the right, green graphs display estimated mass detection limits (according to the BT-Settl model) as a function of separation in AU. In order to keep track of the azimuthal variation, the lower thick line represents the minimum value found at a given radial distance r, while upper thin line is the maximum value. Black dots represent companion within the known planetary systems.
Current usage metrics show cumulative count of Article Views (full-text article views including HTML views, PDF and ePub downloads, according to the available data) and Abstracts Views on Vision4Press platform.
Data correspond to usage on the plateform after 2015. The current usage metrics is available 48-96 hours after online publication and is updated daily on week days.
Initial download of the metrics may take a while.