Free Access
Fig. 22
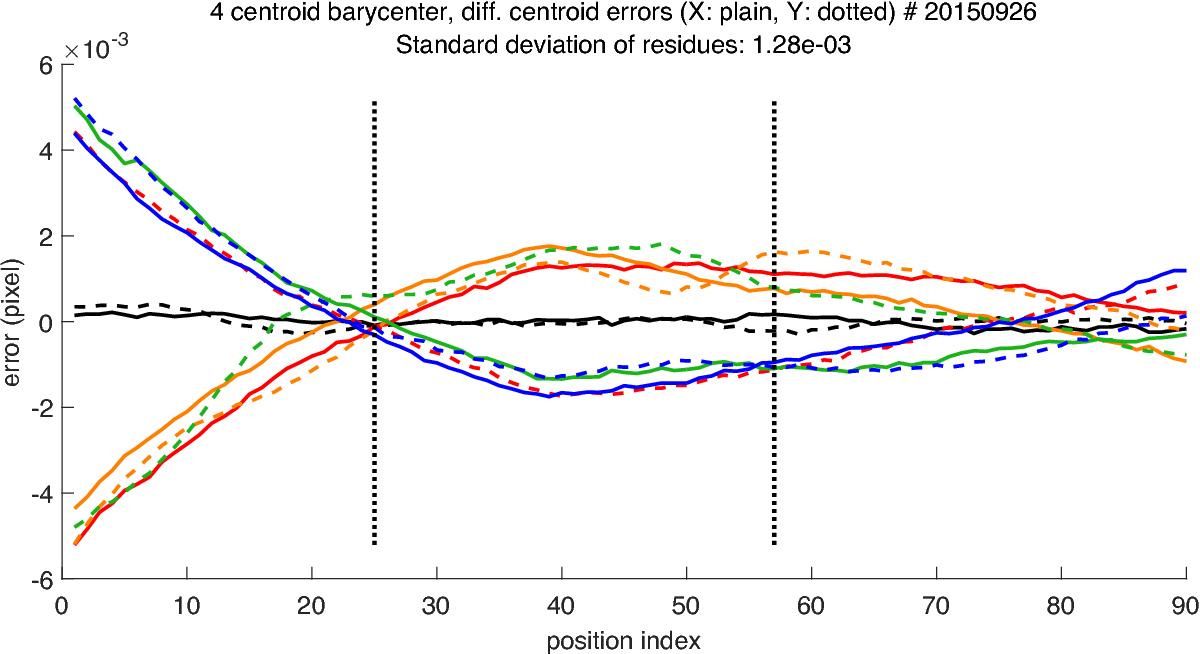
Barycenter residuals for each position (from index 1 to 90). Each centroid has a different color (black for the central one). Plain lines are X axis residuals, dotted lines are Y axis residuals. Indexes between 25 to 57 (final dataset for accuracy) are indicated by the vertical dotted lines.
Current usage metrics show cumulative count of Article Views (full-text article views including HTML views, PDF and ePub downloads, according to the available data) and Abstracts Views on Vision4Press platform.
Data correspond to usage on the plateform after 2015. The current usage metrics is available 48-96 hours after online publication and is updated daily on week days.
Initial download of the metrics may take a while.