Fig. 21
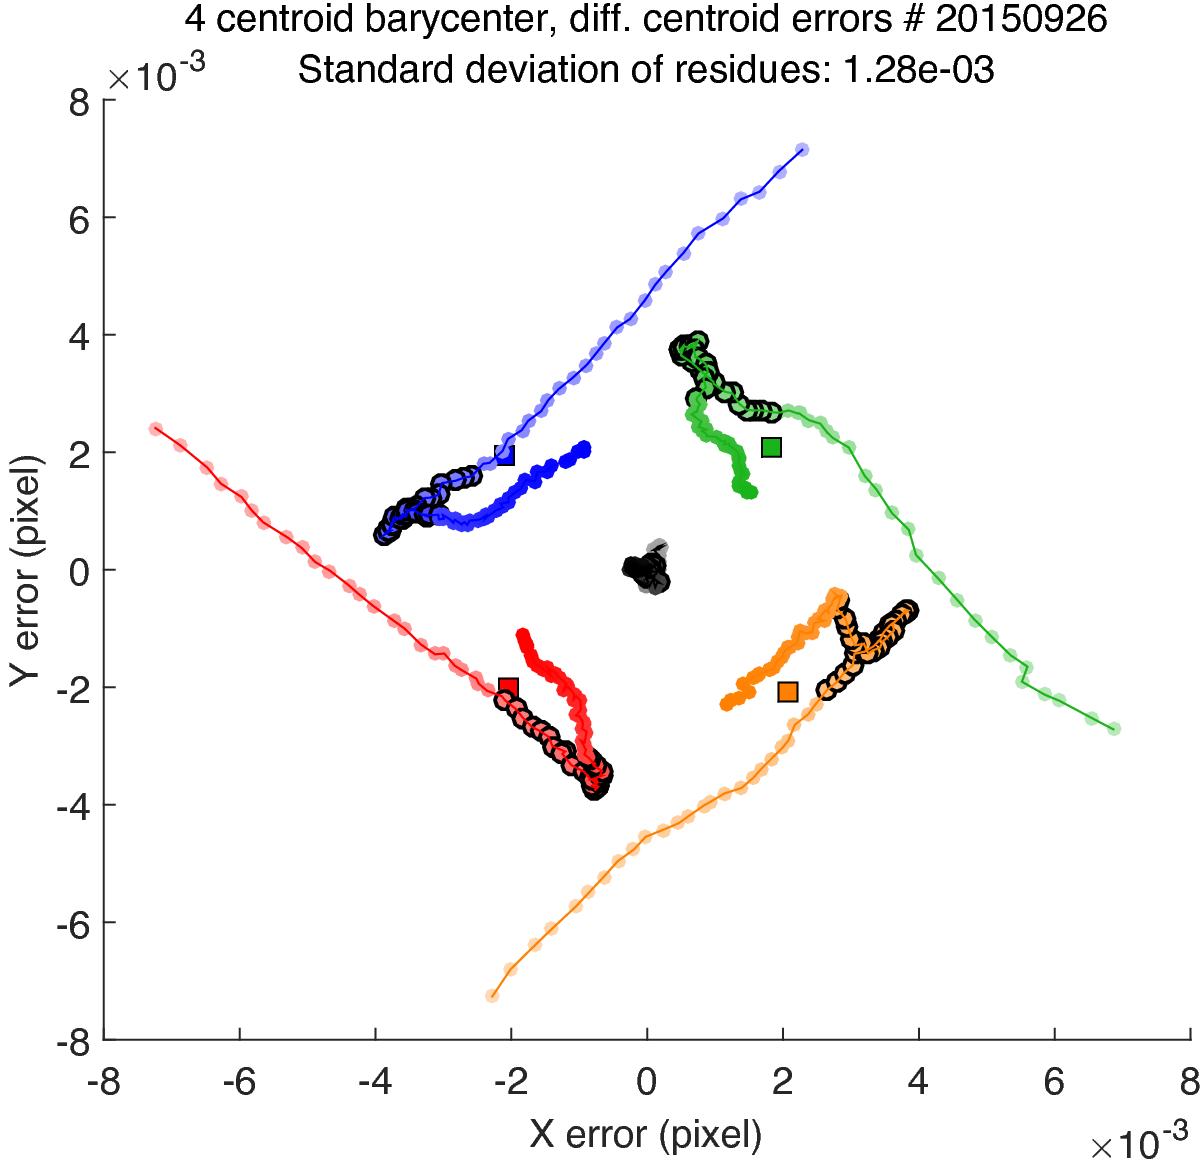
Barycenter residuals for each position (from index 1 to 90). Each centroid has a different color (black centroid is the central one). The relative positions between pseudo stars (illustrated by the squares) have been downscaled to correspond to the magnitude of the residuals. Indexes between 25 to 57 (final dataset for accuracy) are circled in black.
Current usage metrics show cumulative count of Article Views (full-text article views including HTML views, PDF and ePub downloads, according to the available data) and Abstracts Views on Vision4Press platform.
Data correspond to usage on the plateform after 2015. The current usage metrics is available 48-96 hours after online publication and is updated daily on week days.
Initial download of the metrics may take a while.