Fig. 13
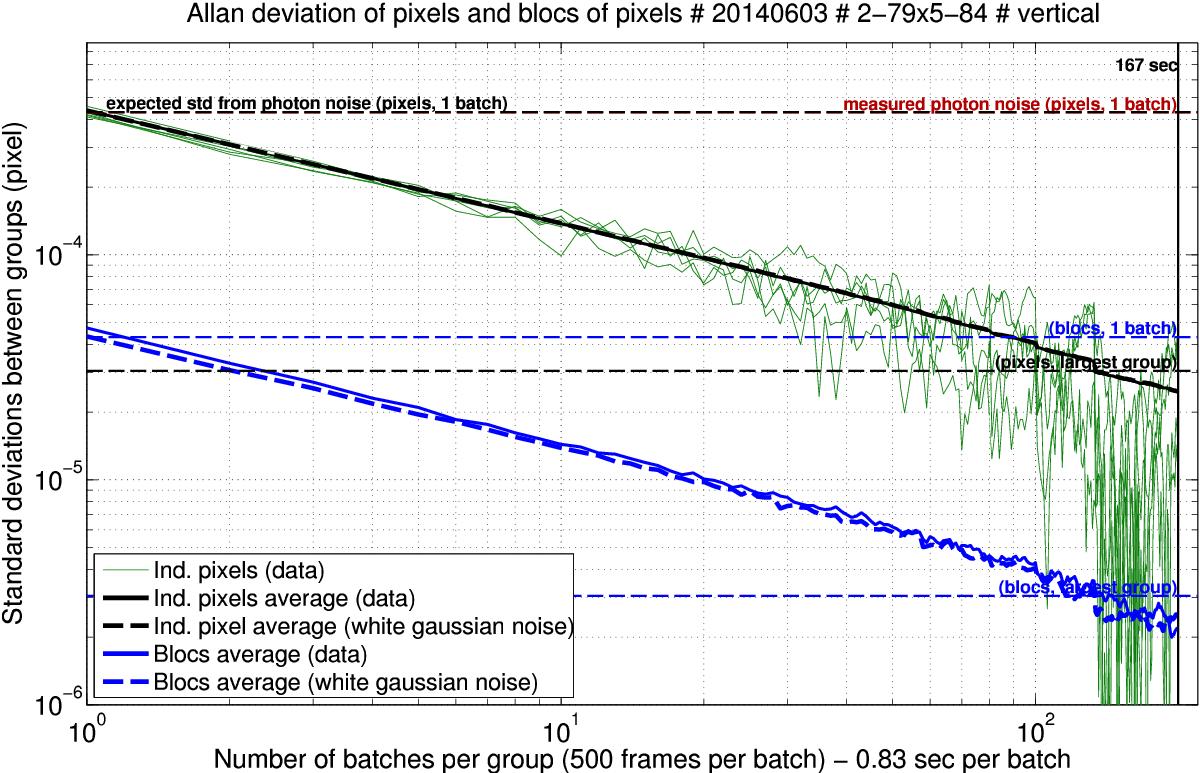
Allan deviations of simulated data. Amplitude, visibility and photon noise of simulated fringes are adjusted to values typical of a real experiment (B = 10 000 counts, A = 6000 counts, 1 count = 10 photo-electrons). Additional sources of noise are simulated, such as laser intensity (1 × 10⁻² RSD), fringe phase (1 × 10⁻² radian SD) and PRNU (1 × 10⁻⁵ RSD). The plot shows deviations for individuals pixels (plain green), their average deviation (plain black) and the average for blocks of 10 by 10 pixels in (plain blue). The dotted black and blue curves are for a cube of white noise whose standard deviation is matched to the data for groups of 1 batch. Averaging Allan deviations over pixels or blocks is important because they tend to be noisy (plain green) when the final deviation is derived from very few groups. Horizontal dotted blue and black lines are estimations of the photon limit for individual pixels or blocks of 10 by 10 pixels.
Current usage metrics show cumulative count of Article Views (full-text article views including HTML views, PDF and ePub downloads, according to the available data) and Abstracts Views on Vision4Press platform.
Data correspond to usage on the plateform after 2015. The current usage metrics is available 48-96 hours after online publication and is updated daily on week days.
Initial download of the metrics may take a while.