Free Access
Fig. 11
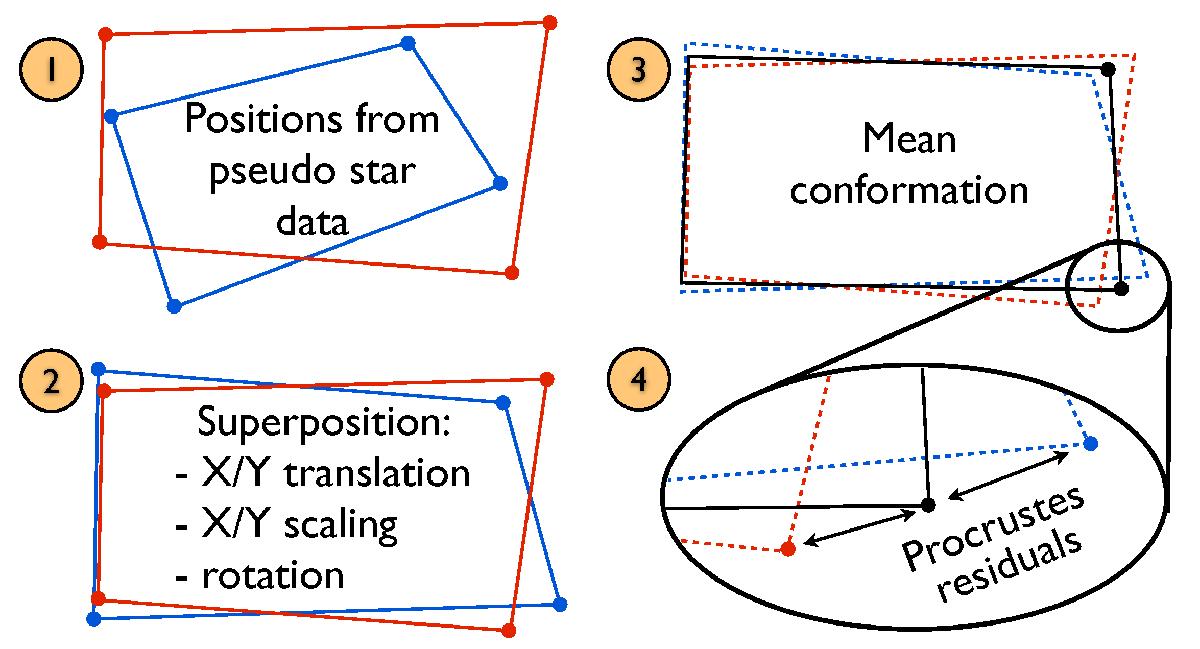
Diagram of the Procrustes analysis. The relative centroid positions for two geometric conformations, each corresponding to one detector position, are represented respectively in red and blue. The black conformation (plain black line at step 3) is the average between the red and the blue ones.
Current usage metrics show cumulative count of Article Views (full-text article views including HTML views, PDF and ePub downloads, according to the available data) and Abstracts Views on Vision4Press platform.
Data correspond to usage on the plateform after 2015. The current usage metrics is available 48-96 hours after online publication and is updated daily on week days.
Initial download of the metrics may take a while.