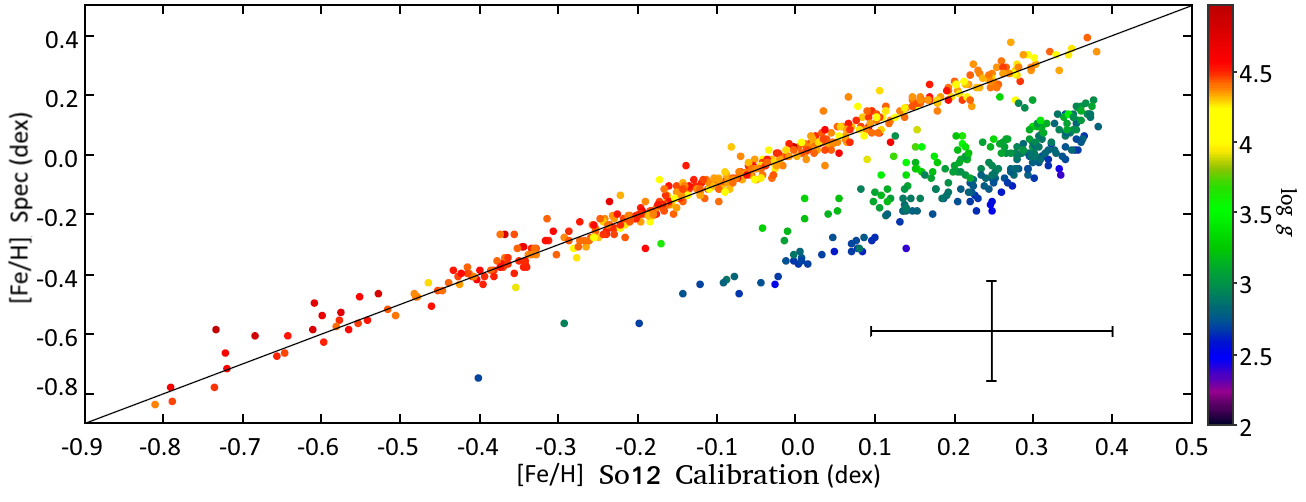
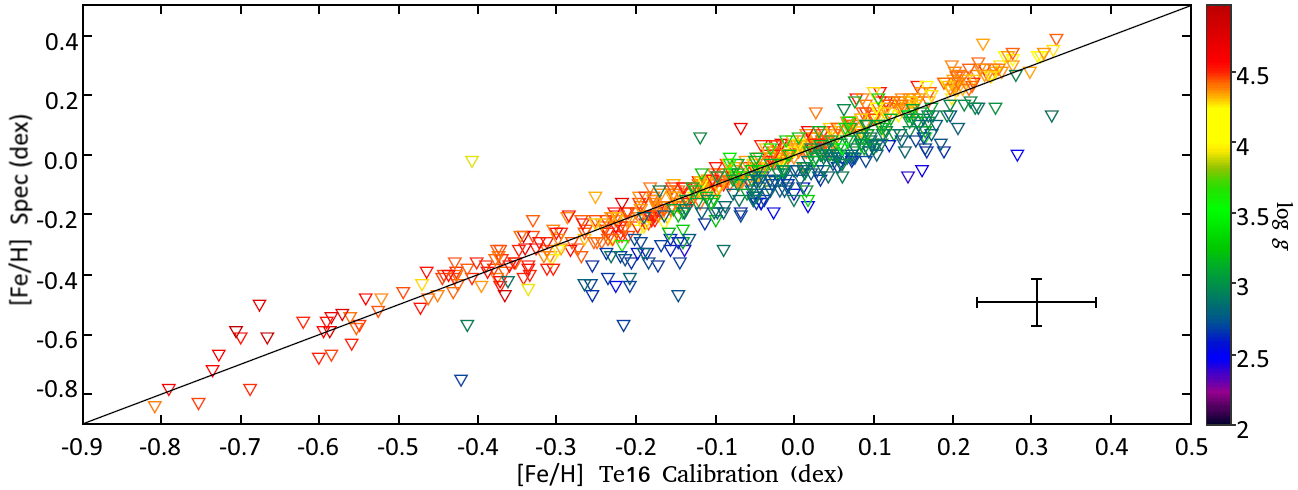
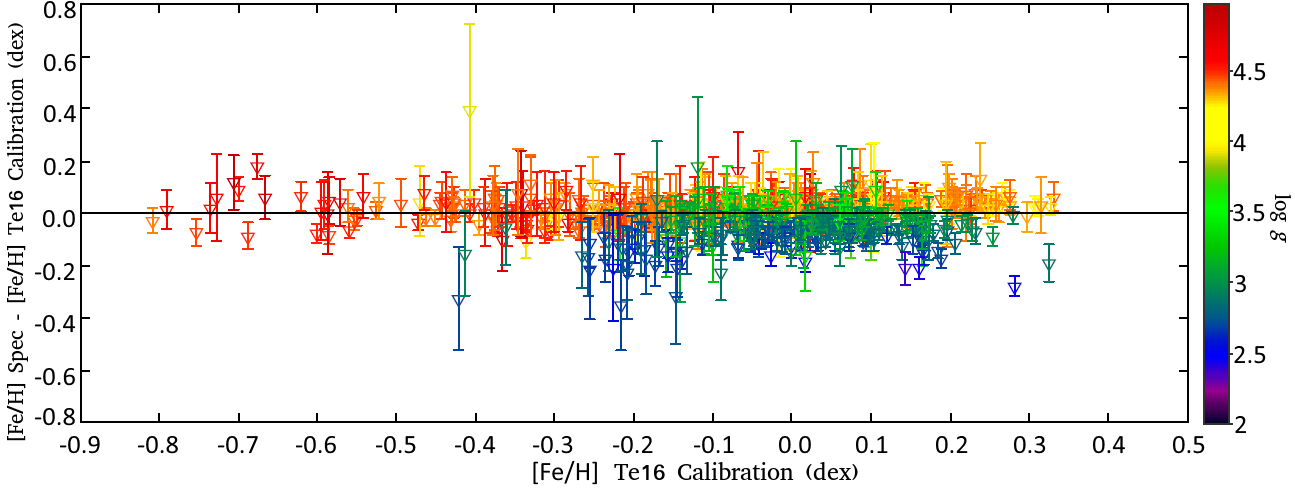
Fig. 5
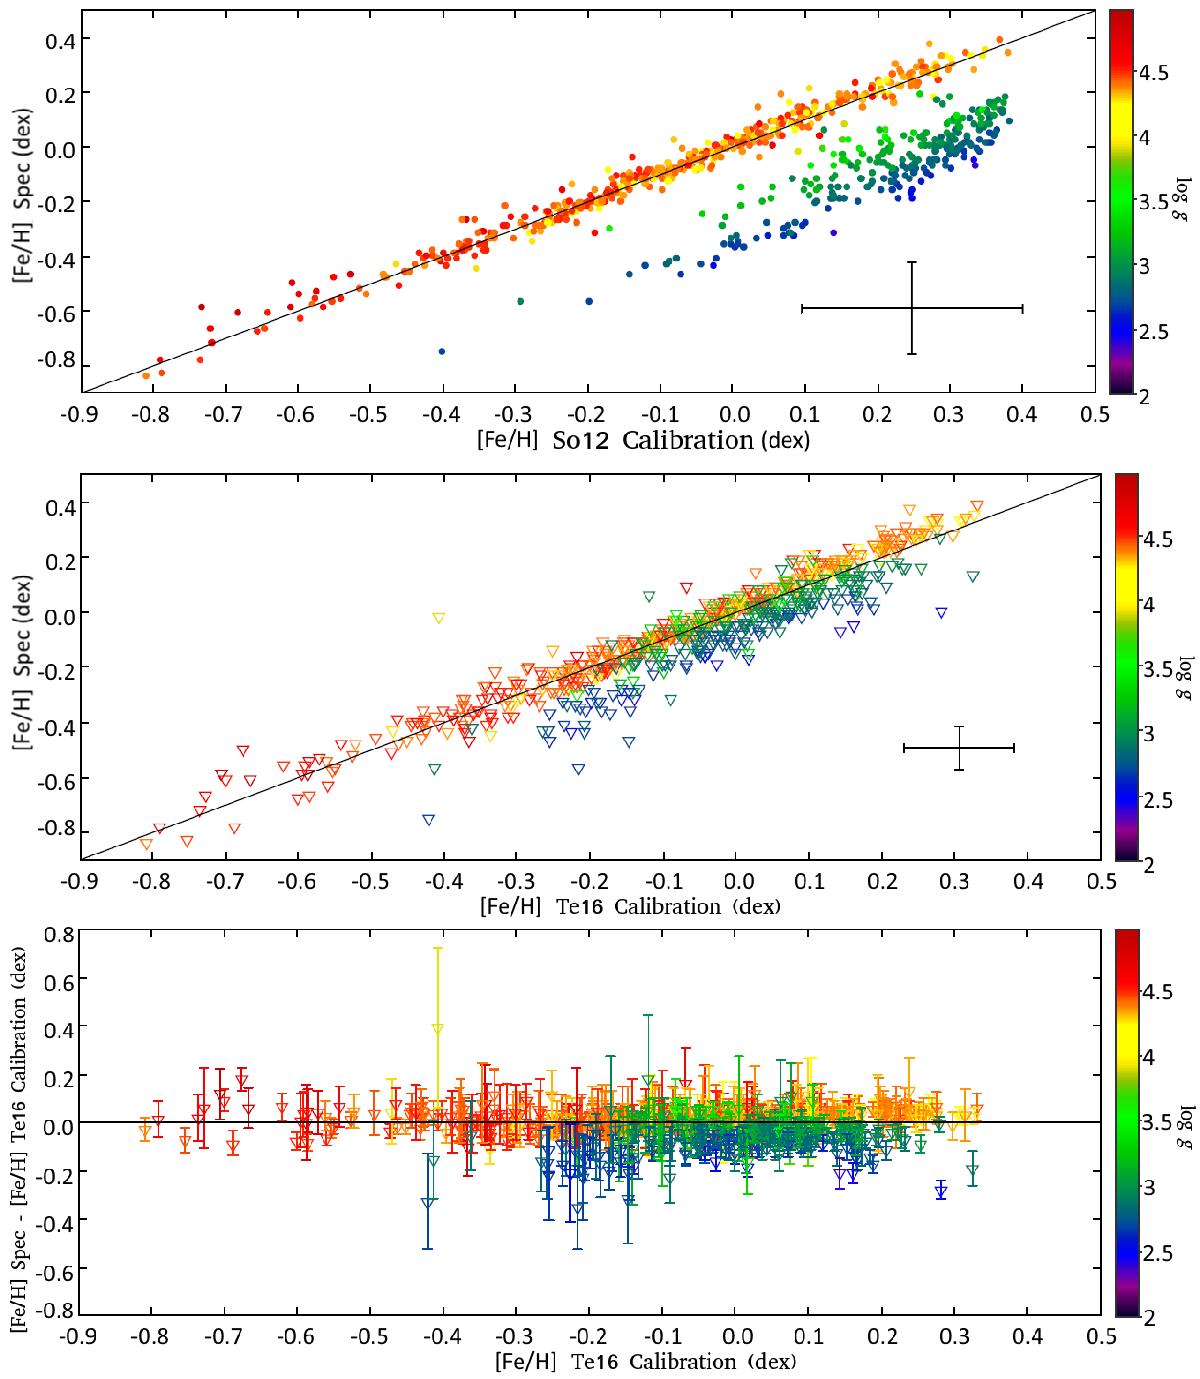
Comparison between the [Fe/H] computed in this work and the spectroscopic values for the So12 calibration (top panel) and the Te16 calibration (middle panel) for the joint sample. The black line represents the identity line, the standard deviation is shown as the cross. The bottom panel shows the difference between [Fe/H] from spectroscopy and the one in this work as a function of [Fe/H], the error bars are the errors resulting from this work. The plots are colour-coded for log g.
Current usage metrics show cumulative count of Article Views (full-text article views including HTML views, PDF and ePub downloads, according to the available data) and Abstracts Views on Vision4Press platform.
Data correspond to usage on the plateform after 2015. The current usage metrics is available 48-96 hours after online publication and is updated daily on week days.
Initial download of the metrics may take a while.