Fig. 9
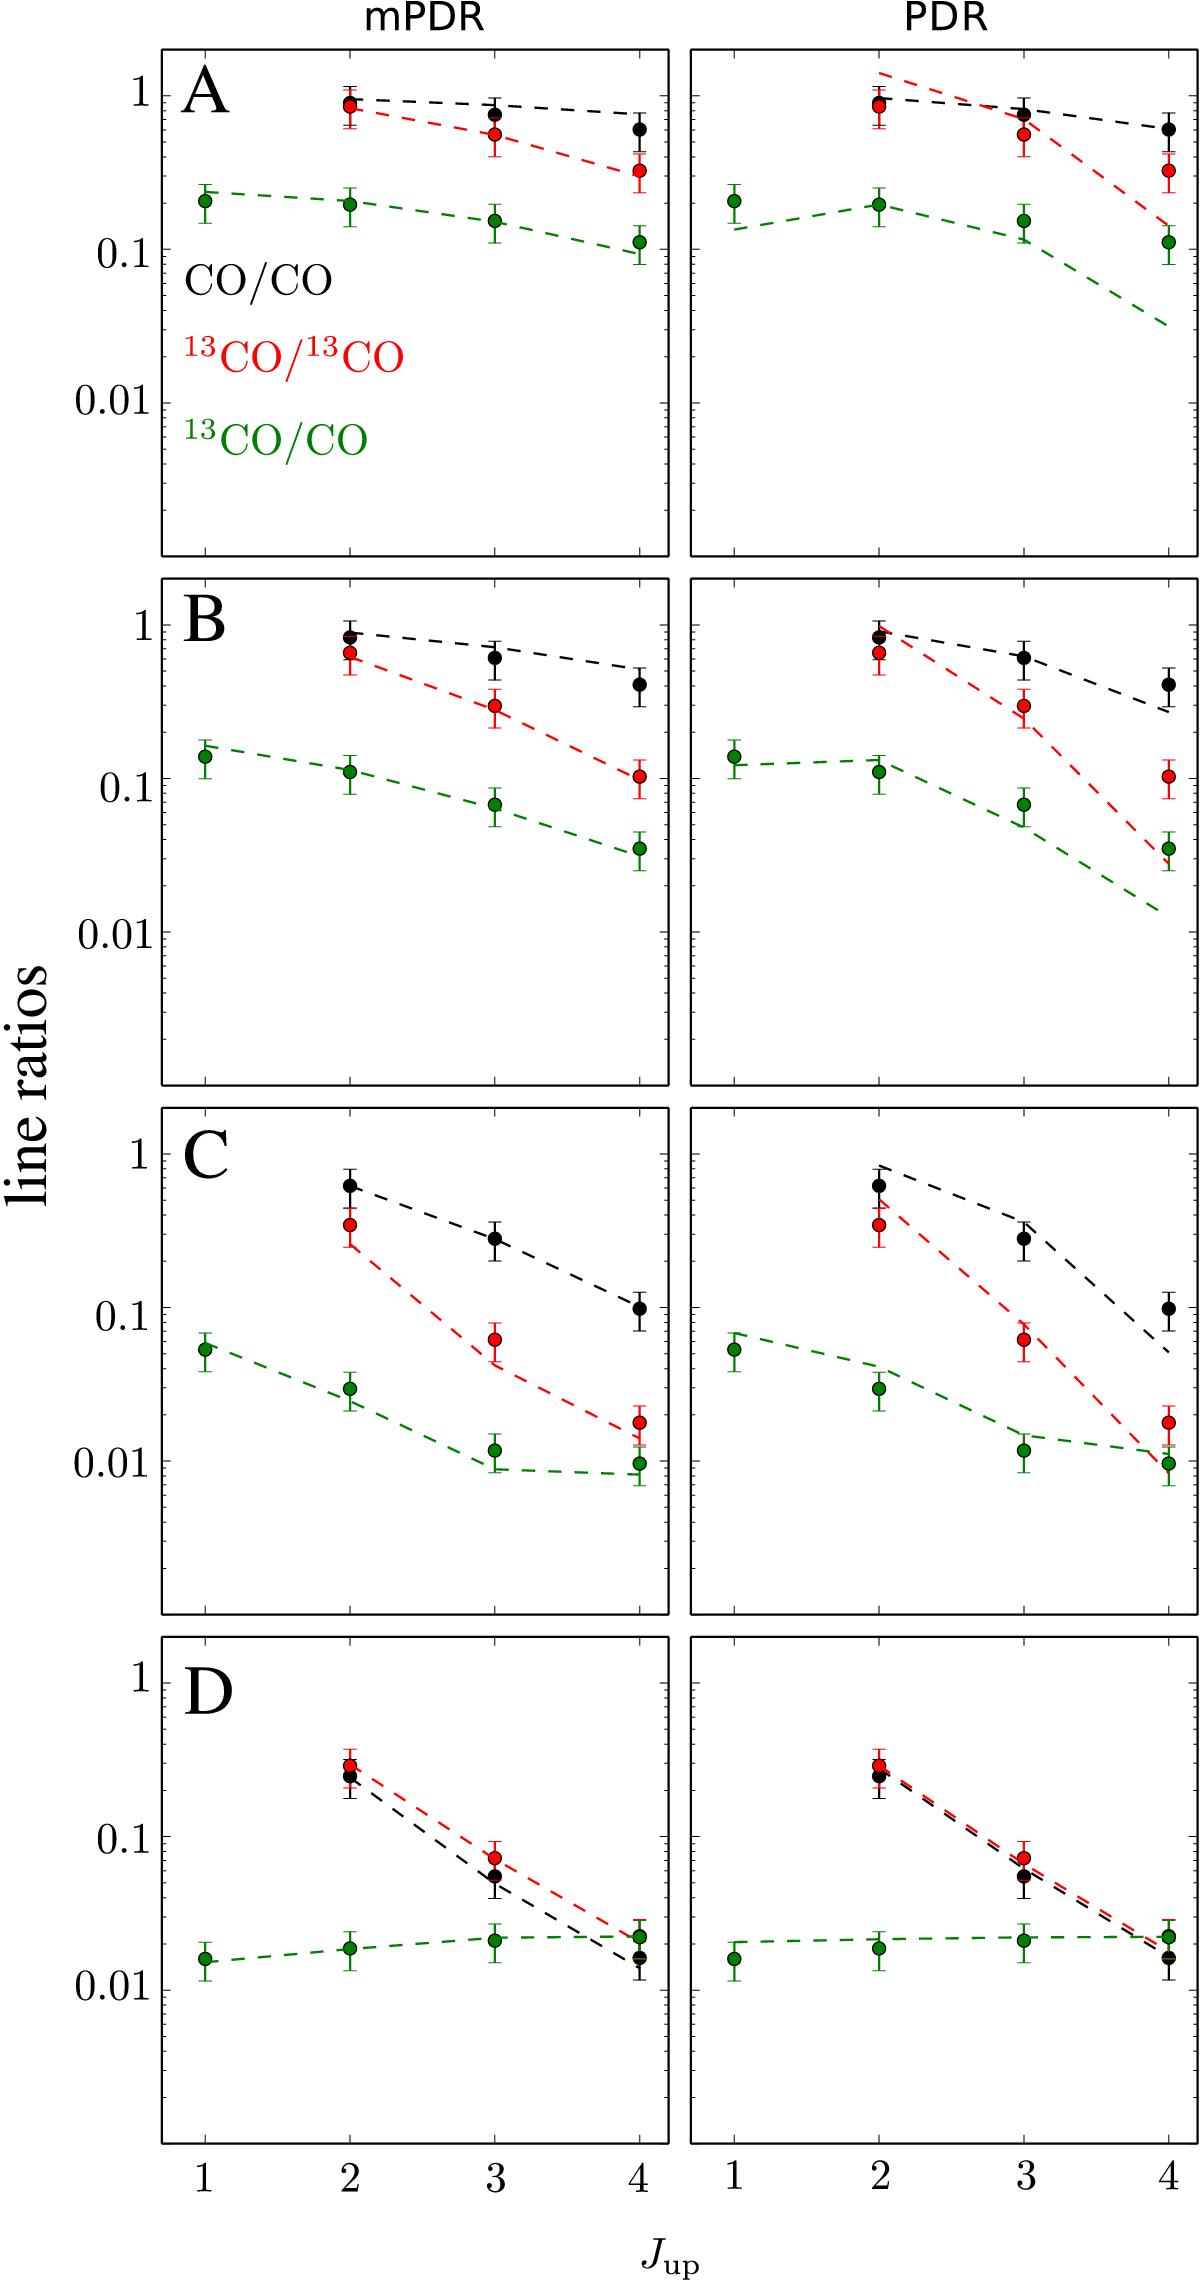
Constraining the parameters for a resolved galaxy. The black dots correspond to the line ratios of CO(J ≥ 2−1) with CO(1–0) for a pixel in the emission map. The red dots correspond to the line ratios of 13CO (J ≥ 2−1) with 13CO (1–0) for the same pixel. The green dots correspond to the line ratios of the same transitions of 13CO and CO for a pixel. The dashed line are the line ratios of these transitions of the best fit PDR model. The PDR models in the left column labeled “mPDR” consider a range of possible Γmech in the heating budget while fitting these line ratios (the dots), while the plots labeled “PDR” do not take Γmech into account. The labels A, B, C, and D correspond to the pixels indicated in the top panel of Fig. 8. The parameters of the best fit PDR models for each pixel are listed in Table 2.
Current usage metrics show cumulative count of Article Views (full-text article views including HTML views, PDF and ePub downloads, according to the available data) and Abstracts Views on Vision4Press platform.
Data correspond to usage on the plateform after 2015. The current usage metrics is available 48-96 hours after online publication and is updated daily on week days.
Initial download of the metrics may take a while.