Fig. 8
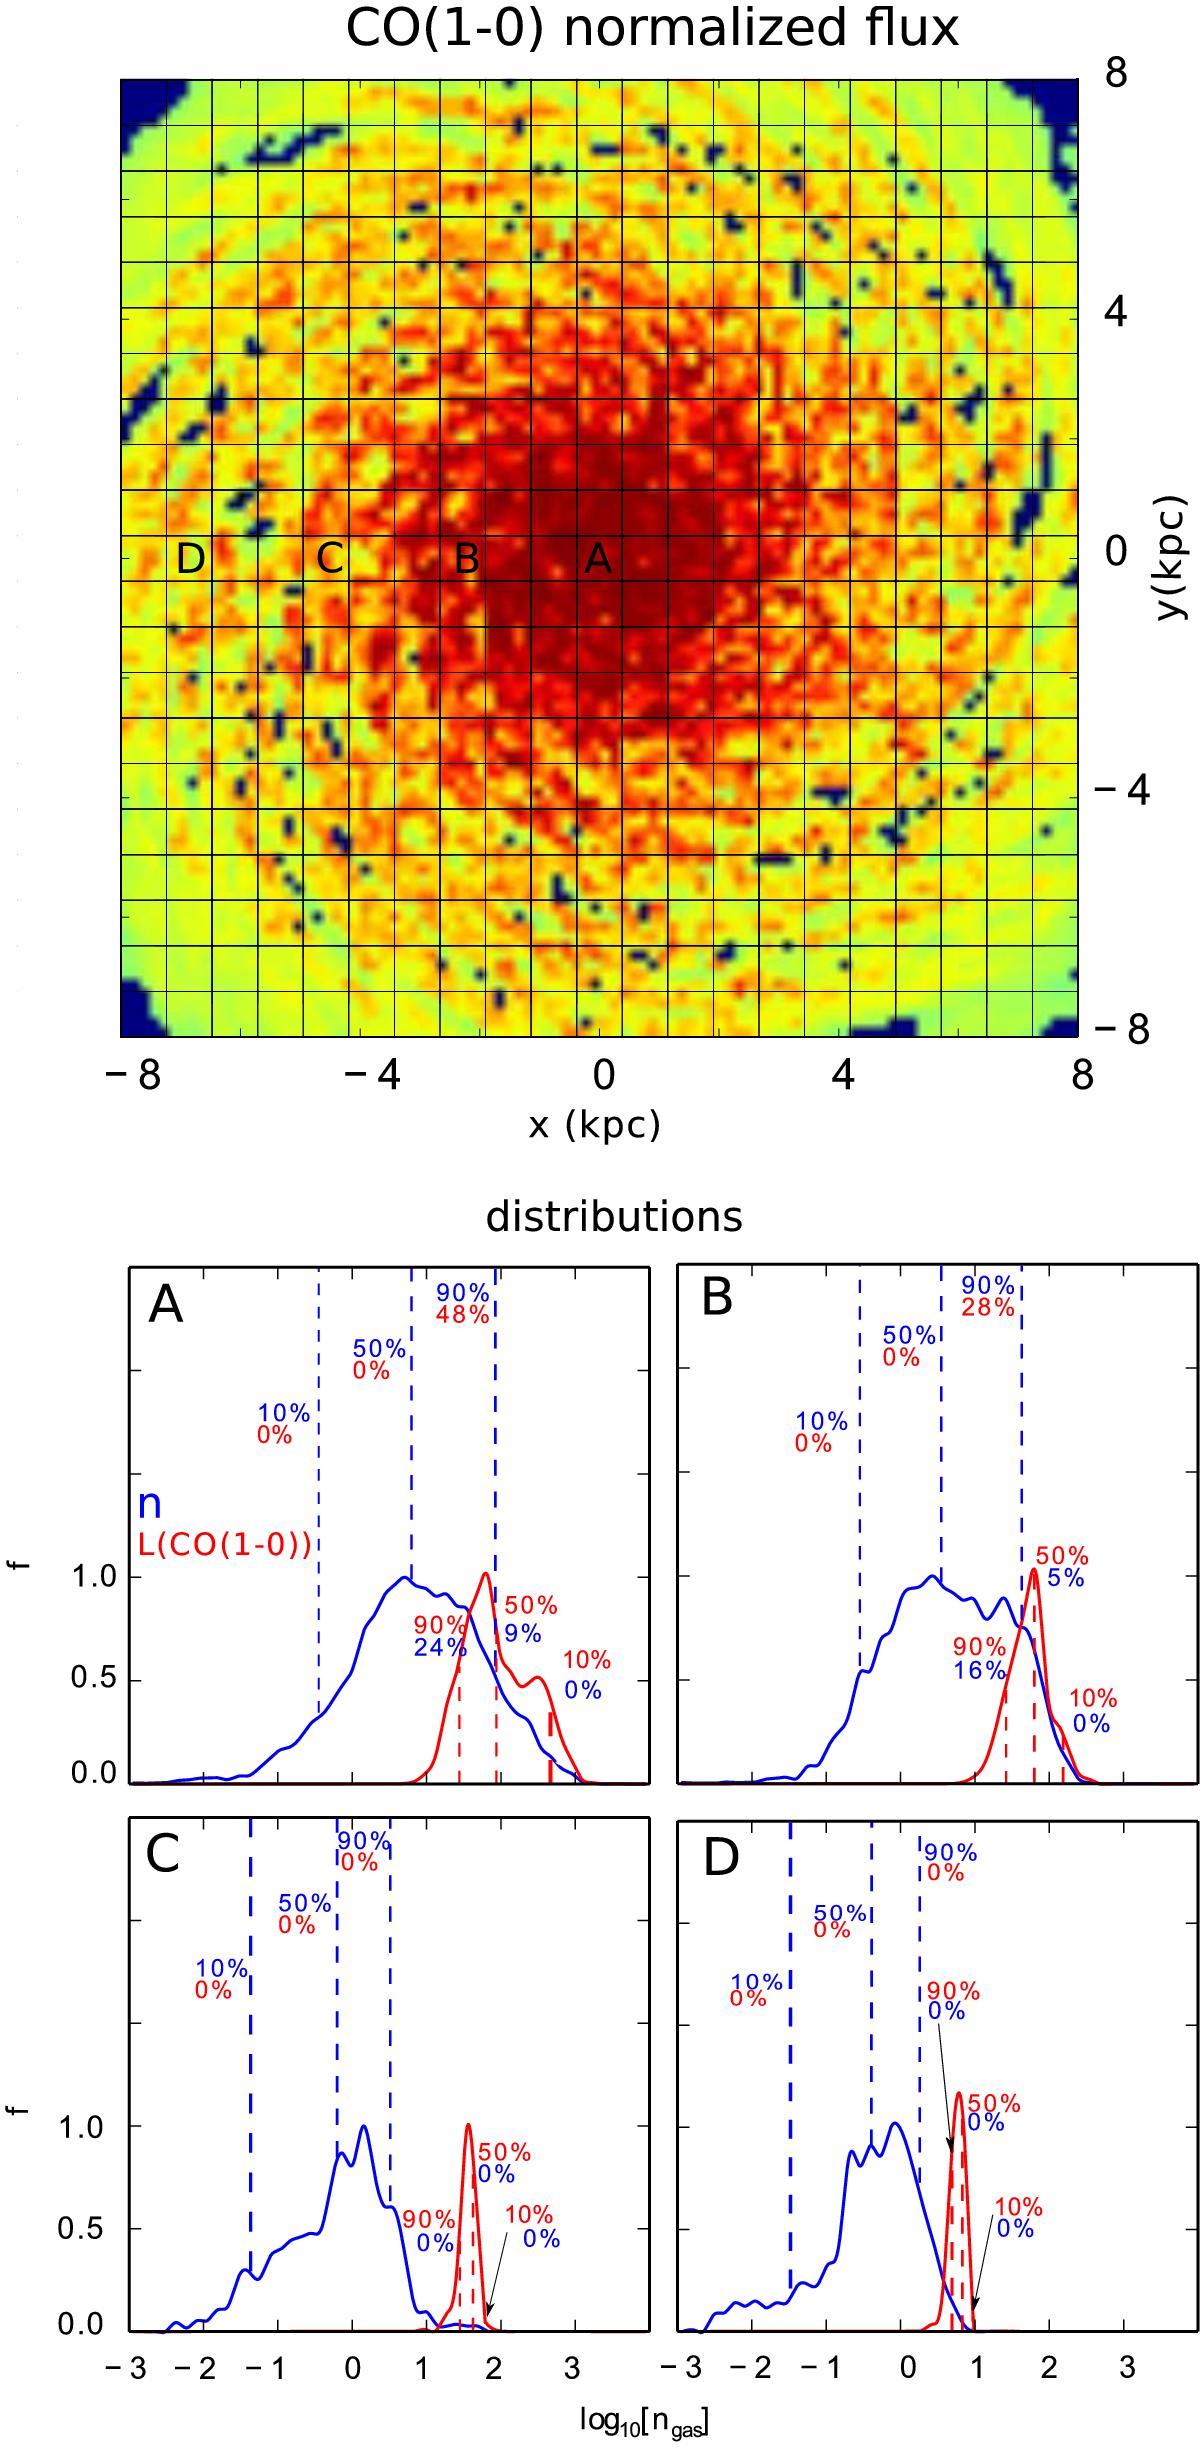
Distributions of gas density and W(CO(1−0)) as a function of distance from the center of the disk galaxy. The normalized WCO(1−0) map, with the overlaid grid which has a resolution of 21 × 21 pixels is shown in the upper panel. The labels A, B, C, D correspond to the pixels at distances of 0, 2, 4, and 7 kpc from the center of the galaxy. In the bottom panels we plot, in blue, the gas density distribution function, f(n), of the SPH particles in these pixels. The fractional contribution of the SPH particles to the CO(1–0) luminosity of the pixel as a function of gas density, f(LCO(1−0))(n), is plotted in red. Both curves are scaled to their maximum value so that we can compare the ranges where they overlap. The cumulative distribution function is defined as ![]() . The blue dashed lines indicate the gas densities where the CDF = 10,50,90% respectively. Below these percentages, in red, are the fractional contribution of these SPH particles to the luminosity of the pixel. This contribution is defined as
. The blue dashed lines indicate the gas densities where the CDF = 10,50,90% respectively. Below these percentages, in red, are the fractional contribution of these SPH particles to the luminosity of the pixel. This contribution is defined as ![]() . The red dashed lines represent the
. The red dashed lines represent the ![]() along with the analogous CDF integrated from n = 104 cm-3 . The corresponding distribution plots as a function of G0, Γmech and AV are shown in Fig. A.2.
along with the analogous CDF integrated from n = 104 cm-3 . The corresponding distribution plots as a function of G0, Γmech and AV are shown in Fig. A.2.
Current usage metrics show cumulative count of Article Views (full-text article views including HTML views, PDF and ePub downloads, according to the available data) and Abstracts Views on Vision4Press platform.
Data correspond to usage on the plateform after 2015. The current usage metrics is available 48-96 hours after online publication and is updated daily on week days.
Initial download of the metrics may take a while.