Fig. 7
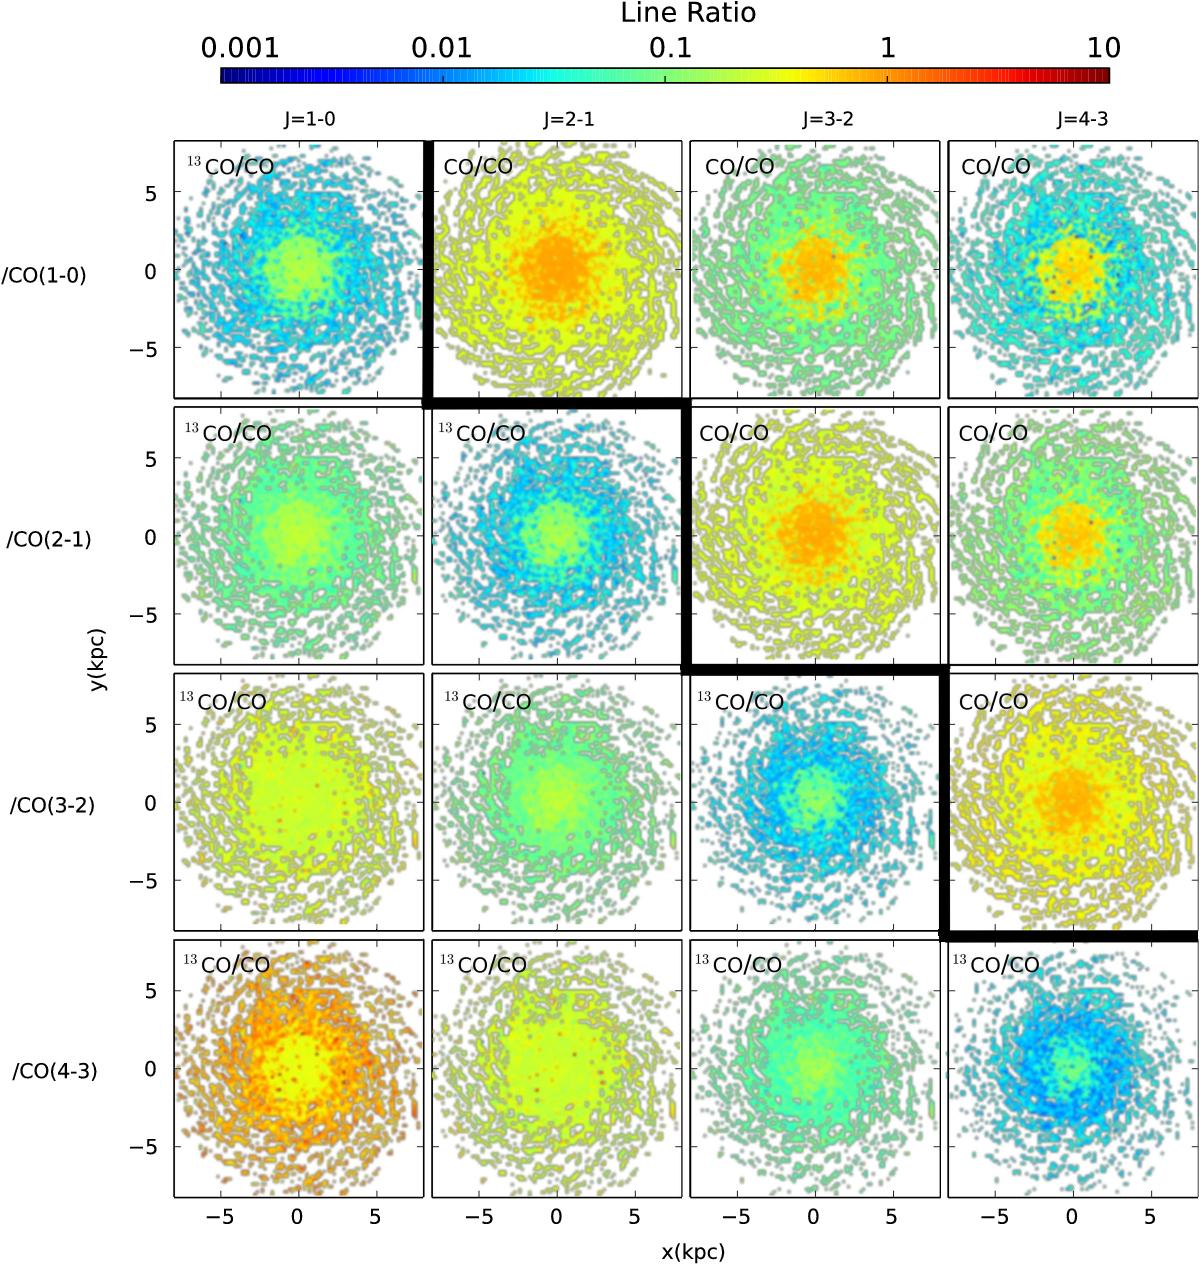
Line ratio maps for various transitions of CO and 13CO for the disk galaxy. The transition of the line in the numerator is specified at the top of each column, whereas that of the denominator is specified at the left of each row. For example, the panel in the third row of the second column corresponds to the line ratio map of 13CO (2–1)/CO(3–2); the species involved in the line ratio are specified at the top left corner of each panel. Ratios larger than unity are typical to the central regions R < 2 kpc. Line ratio maps between CO transitions are to the right of the zig-zagged line, whereas the remaining maps are for line ratios between 13CO and CO. Ratios involving J ≥ 3−2 transitions trace the small scale structure of the molecular gas for R > 2 kpc.
Current usage metrics show cumulative count of Article Views (full-text article views including HTML views, PDF and ePub downloads, according to the available data) and Abstracts Views on Vision4Press platform.
Data correspond to usage on the plateform after 2015. The current usage metrics is available 48-96 hours after online publication and is updated daily on week days.
Initial download of the metrics may take a while.