Fig. 5
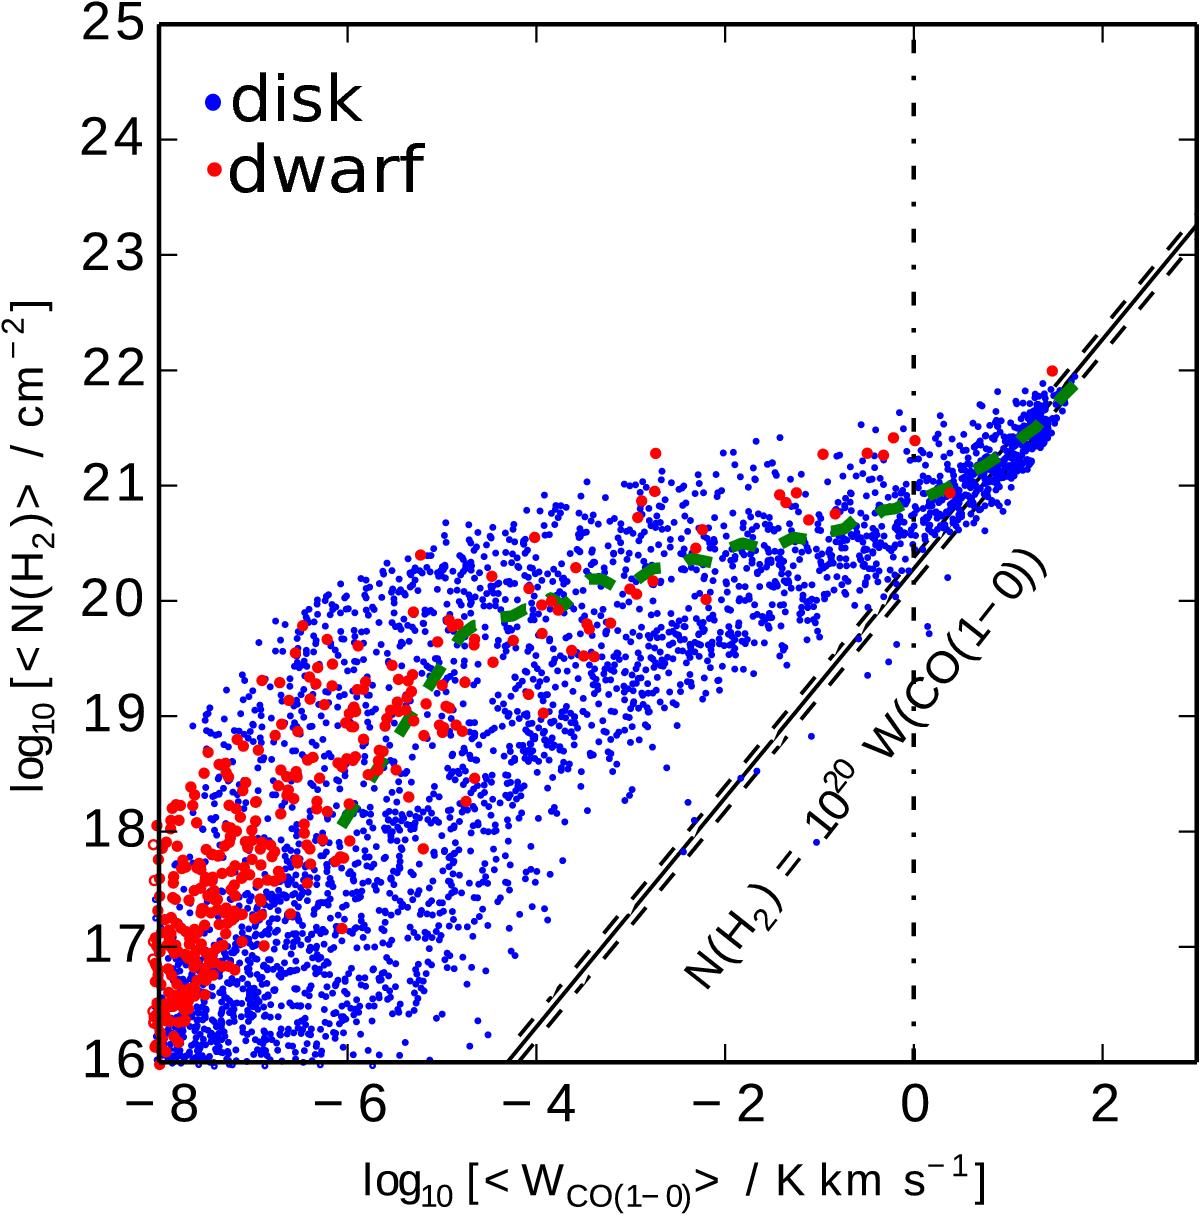
N(H2) vs. CO(1–0) flux of the synthetic emission maps for the disk and dwarf galaxies. The blue and red points correspond to the pixels of the disk and dwarf galaxies respectively. The solid black line is the WCO(1−0) = XCO,MWN(H2) curve, with the observed ±30% uncertainty band (Bolatto et al. 2013) shown by the black dashed lines. This uncertainty could be up to a factor of two under a variety of conditions. XCO for pixels with WCO(1−0) < 10K km s-1 diverges from that of the Milky way, where the mean XCO for the pixels is plotted in green. We note that 99% of the luminosity of the disk galaxy emanates from pixels whose WCO(1−0)> 1K km s-1 indicated by the dot-dashed line.
Current usage metrics show cumulative count of Article Views (full-text article views including HTML views, PDF and ePub downloads, according to the available data) and Abstracts Views on Vision4Press platform.
Data correspond to usage on the plateform after 2015. The current usage metrics is available 48-96 hours after online publication and is updated daily on week days.
Initial download of the metrics may take a while.