Fig. A.3
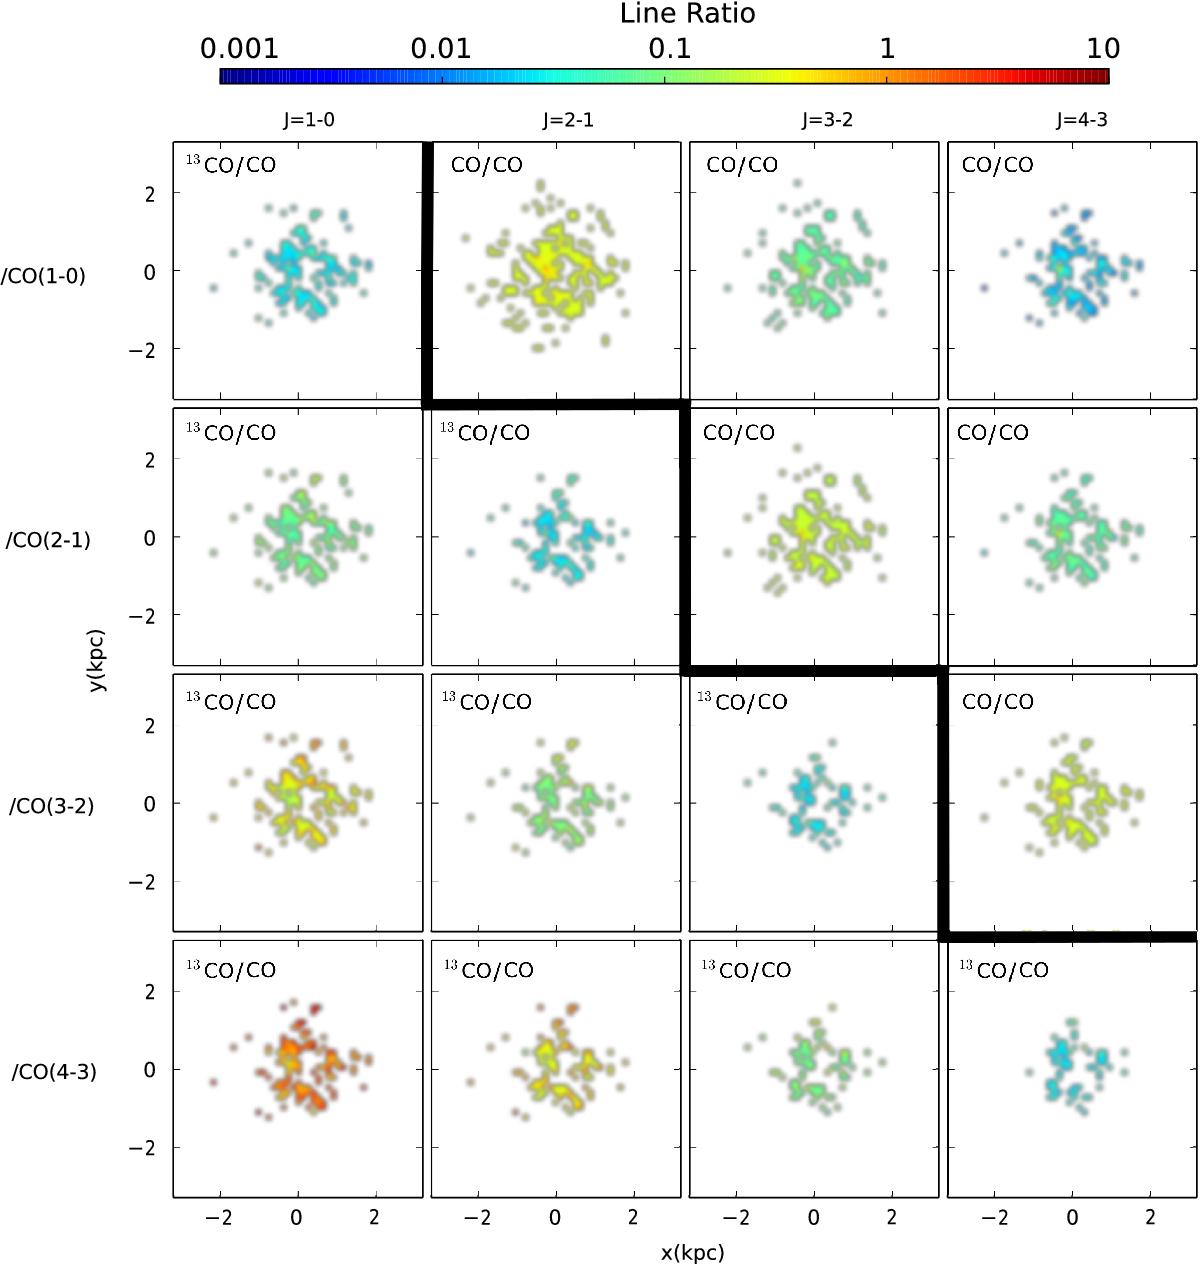
Line ratio maps for various transitions of CO and 13CO for the dwarf galaxy. The line ratios are generally spatially uniform and show slight variation, unlike the disk galaxy. These maps are also patchy, especially for line ratios involving J = 3−2 and J = 4−3 transitions. This is due to the low number of SPH particles with densities close to 104 cm-3 which are a pre-requisites for these transitions. See caption of Fig. 7 for more details on interpreting the maps.
Current usage metrics show cumulative count of Article Views (full-text article views including HTML views, PDF and ePub downloads, according to the available data) and Abstracts Views on Vision4Press platform.
Data correspond to usage on the plateform after 2015. The current usage metrics is available 48-96 hours after online publication and is updated daily on week days.
Initial download of the metrics may take a while.